
How to Build an Ansoff Matrix Growth Slide in PowerPoint
How to lay out the axes, name the four growth strategies, write one move per quadrant, avoid the mistakes that blur the risk story, and the prompts that render an editable native slide for you.
Free skills and prompts for Claude and strategy work
Templates for Claude, ChatGPT and Perplexity — from diagnostics to board-ready decks.
Independent and unaffiliated. The skills, prompts, and frameworks referenced on this page are not created by, endorsed by, or affiliated with McKinsey, Bain, BCG, Goldman Sachs, or any other firm named here. They are built on publicly available frameworks and ways of working those firms are known for, and are inspired by how those approaches are used to tackle complex business problems.
How to build an Ansoff matrix slide in PowerPoint
To build an Ansoff matrix slide in PowerPoint, draw a 2x2 with Products on the horizontal axis (Existing on the left, New on the right) and Markets on the vertical axis (Existing at the bottom, New at the top). Name the four quadrants Market Penetration, Product Development, Market Development, and Diversification, then write one concrete growth move under each. Emphasize the high-risk Diversification corner so the slide reads risk as a diagonal. PowerPoint has no native 2x2, so you build it from text boxes and lines, and Oria can render the whole thing as an editable native slide from one line of text.
This guide walks the manual build, gives you the exact prompts to classify growth options into the four quadrants, and shows the faster one-prompt route. Everything you need is here. You will not have to leave to get the substance.
What the Ansoff growth matrix is and when to use it
The Ansoff matrix is a 2x2 that frames how a business can grow. The two dimensions are products and markets, each either existing or new, and the four combinations give four growth strategies with rising risk. It works because almost every growth idea is really a bet on either selling more of what you have, building something new, reaching someone new, or doing both at once.
Reach for it when the question is where growth should come from and you want the risk trade-off to be obvious. A strategy review, a board pre-read on the growth plan, or a corporate development memo all fit. It is a sorting and framing tool, not a data chart, so the value is in clean axes and one honest move per quadrant. When the question is instead which existing units to fund or harvest, a BCG growth-share matrix slide is the better fit; use Ansoff when the message is a growth direction.
The four quadrants of the Ansoff matrix
Four growth strategies carry the whole slide. Get the labels and the risk order right and the matrix reads itself.
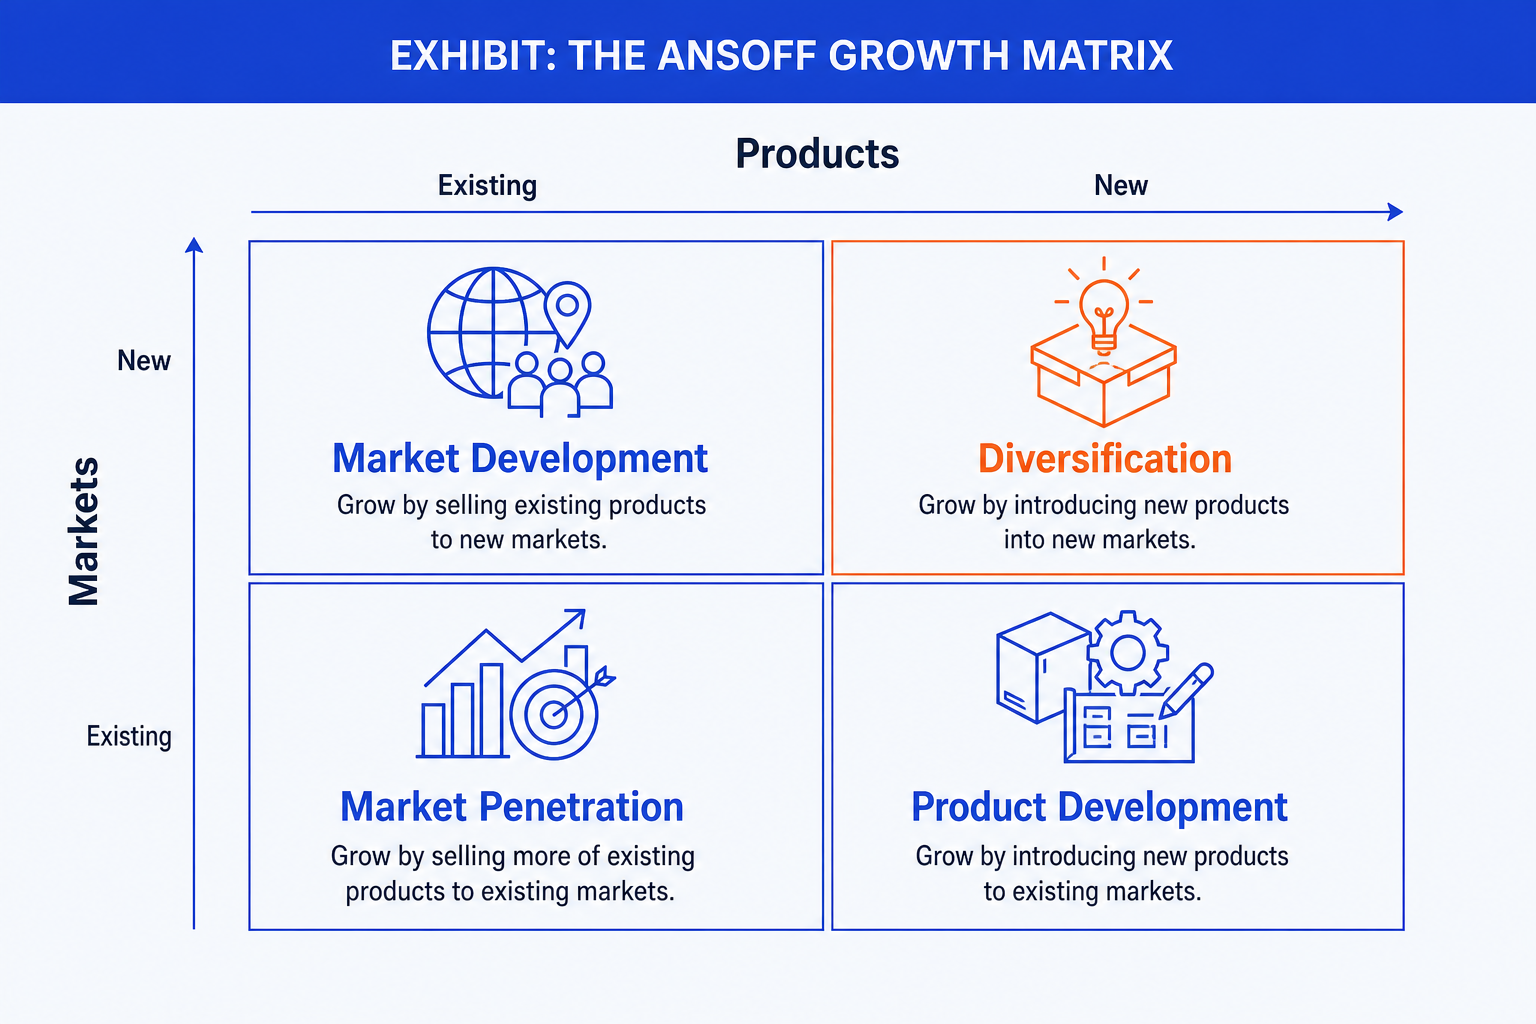
Market Penetration. Existing products in existing markets, the bottom-left, lowest-risk corner. Grow by selling more to the customers you already serve through price, share gains, or higher usage.
Product Development. New products for existing markets, bottom-right. Grow by building new offers for the customers you already understand, reusing the channel and the brand.
Market Development. Existing products taken into new markets, top-left. Grow by reaching new geographies, segments, or channels with what you already make.
Diversification. New products in new markets, the top-right, highest-risk corner. Both dimensions change at once, so give it the emphasis color to mark where the risk concentrates.
Build the Ansoff matrix slide step by step
PowerPoint has no 2x2 chart type, so you build the frame from lines and text boxes. The steps below produce the clean, presentable version.
Draw the 2x2 frame. Place a horizontal line and a vertical line crossing at the centre to split the canvas into four equal quadrants, then add a light outer frame so the field is contained.
Label the axes. Put Products on the horizontal axis, Existing on the left and New on the right. Put Markets on the vertical axis, Existing at the bottom and New at the top. Keep this orientation so risk reads as a diagonal.
Name the four quadrants. Market Penetration bottom-left, Product Development bottom-right, Market Development top-left, Diversification top-right. Use the standard names so the audience recognises the framework instantly.
Add one move per quadrant. Under each label, write a single concrete growth move for your business in plain words, not a generic definition. One line each keeps the slide scannable and specific.
Format and align. Give each quadrant equal size, align the four text blocks on a shared grid, and shade or recolor the Diversification corner in the accent so the eye lands on the highest-risk path. Replace the topic label with an action title that states the growth recommendation.
Gotcha
Keep the axis orientation standard. If you flip New and Existing on either axis, Diversification stops sitting in the top-right and the risk diagonal breaks. Senior readers expect Market Penetration in the safe bottom-left corner, so honor the convention rather than inventing your own layout.
The one-prompt route: describe the four moves, get an editable matrix
The crossed lines, the four aligned text blocks, and the accent on the right corner are exactly the kind of mechanical work that eats an evening. Oria removes it. It is an AI add-in that runs in the PowerPoint task pane and produces fully editable native PowerPoint elements in your corporate template. You name the axes and give one growth move per quadrant in a line, and Oria renders the Ansoff matrix slide for you.
Because the output is native, every quadrant label and descriptor stays editable afterward. You can reword a move, recolor the Diversification corner, or swap the action title without rebuilding anything. The same approach works for any complex slide, from an Ansoff 2x2 to a process flow, which is why Oria suits the dense decks consultants and bankers actually ship. See the complete guide to McKinsey presentations with Claude for the storyline side of the workflow.
One-line Ansoff prompt for Oria
The prompts that make the Ansoff matrix slide sharp
These are the exact copy-paste prompts to classify growth options, turn a strategy memo into the matrix, and set the emphasis. The first two are for Oria inside PowerPoint; the rest are for sorting the options in Claude before you build. Replace the bracketed parts with your own company and options.
Build the matrix in Oria
Spec the axes and quadrants
Add one move per quadrant and emphasize risk
Classify and draft in Claude first
Classify growth options into the four quadrants
Turn a strategy memo into the matrix
Write one tight move per quadrant
Tip
Settle the classification and the four moves in Claude, then hand the clean quadrant labels and one-line moves straight to Oria. For a related sorting framework on two crossed dimensions, see how to build a 2x2 positioning matrix slide.
Common mistakes to avoid
For the full draft-to-deck method that feeds prompts like these into board-ready slides, see the consultant's guide to Claude. Match the framework to the message.
Frequently asked questions
What is an Ansoff matrix slide used for?
An Ansoff matrix slide sorts growth options into four strategies by whether they use existing or new products and existing or new markets. Strategy, corporate development, and finance teams use it to frame where growth will come from and how much risk each path carries. The point of the slide is the growth choice across the four quadrants, not the precise placement of any single initiative.
What are the four quadrants of the Ansoff matrix?
Market Penetration is existing products in existing markets, the lowest-risk path of selling more to who you already serve. Product Development is new products for existing markets. Market Development is existing products taken into new markets. Diversification is new products in new markets, the highest-risk quadrant because both dimensions change at once.
How is the Ansoff matrix different from a BCG matrix?
The Ansoff matrix is about growth direction: which product-market combinations to pursue next. The BCG growth-share matrix is about portfolio allocation: where to invest in or harvest the units you already run. Ansoff axes are Products and Markets, each existing or new. BCG axes are market growth rate and relative market share. Pick Ansoff when the question is where to grow.
Which way do the axes go on an Ansoff matrix?
The convention is Products on the horizontal axis, Existing on the left and New on the right, and Markets on the vertical axis, Existing at the bottom and New at the top. That puts Market Penetration in the bottom-left, low-risk corner and Diversification in the top-right, high-risk corner. Keeping that orientation lets the audience read risk as a diagonal from bottom-left to top-right.
What is the fastest way to build an Ansoff matrix slide?
Describe the four quadrants and one growth move per quadrant in a single line and let Oria render it. You name the axes and the moves, and Oria builds a fully editable native PowerPoint matrix in your template, with the four quadrant labels and descriptors already placed. You skip the manual axis setup and the hand-aligned text boxes entirely.