
21 Excel-Inspired Claude Skills for Strategy Professionals
21 standalone Claude skills that bring Excel-grade analytical rigour to strategy work. 21 skills across seven domains -- problem framing, data architecture, financial modelling, strategic analysis, scenario and risk, executive reporting, and modelling governance.
Free skills and prompts for Claude and strategy work
Templates for Claude, ChatGPT and Perplexity — from diagnostics to board-ready decks.
Independent and unaffiliated. The skills and frameworks referenced on this page are not created by, endorsed by, or affiliated with McKinsey. They are built on publicly available frameworks and ways of working McKinsey is known for, and are inspired by how those approaches are used to tackle complex business problems.
What this is
21 Claude skills that bring Excel-grade analytical rigour to strategy work. Each skill teaches Claude one high-value analytical or modelling workflow grounded in the methods used at top-tier consulting and finance firms: MECE issue trees, hypothesis-driven problem solving, DCF and sensitivity models, scenario analysis, and board-ready reporting.
They are organised into seven practical domains, from structuring the problem through to producing the executive output. Each domain is a self-contained set of three skills, and each skill is a standalone SKILL.md file you can load into a Claude Project.
The approach is deliberately Excel-inspired rather than slide-first: structure the analysis, build the model, pressure-test the assumptions, then let Oria turn the output into the deck. For a companion set focused on the strategy frameworks themselves, see 21 McKinsey-style strategy skills for Claude. For a walkthrough of working this way end-to-end, see our consultant's guide to Claude.
Download all 21 skills
One zip, one folder per skill. Free, no signup.
The 21 Excel-inspired skills you get
The collection is grouped into seven analytical domains. They run in the order a real engagement does, frame the problem first, govern the model last, but every skill is also useful on its own.
The Excel-inspired strategy skill set
Domain 1 · 3 skills
Problem Framing
Use these before any analysis begins. A MECE issue tree, a hypothesis-first brief, and a modular workplan are the three structural tools that determine whether the work answers the right question.
MECE Issue Tree Builder
Use when: A problem statement exists but lacks analytical structure
Output: Nested MECE issue tree plus flat Excel workplan with one row per sub-issue
Hypothesis-First Brief
Use when: Analysis needs structuring around a leading hypothesis before data work begins
Output: Pyramid Principle brief with governing thought, 3-5 MECE proof points, and minimum evidence set
Problem to Workplan
Use when: Framed issue tree needs converting into an Excel tracker for a multi-week engagement
Output: Full Excel workplan spec with tab inventory, Gantt logic, status formulas, and data validation lists
Domain 2 · 3 skills
Data Architecture
Use these before writing a single formula. The three structural disciplines -- model blueprint, lookup layer, and input-calc-output separation -- prevent the compounding errors that make models unauditable.
Excel Data Model Blueprint
Use when: Starting a new multi-tab model and need a clean structural foundation before any formulas
Output: Full tab inventory, color-coding standard, data-flow diagram, and conventions checklist
Lookup and Reference Layer
Use when: Model needs reference tables or lookup formulas that do not break when columns move
Output: Lookup tab design, named range registry, INDEX-MATCH and XLOOKUP templates, and robustness tests
Inputs-Calcs-Outputs Design
Use when: Model mixes assumptions with formulas and needs separation for auditability
Output: Three-tab design spec with Inputs layout, Calc row structure, Outputs grid, and compliance checklist
Domain 3 · 3 skills
Financial Modelling
Use these for the three most common analytical builds: a DCF, a sensitivity table, and a waterfall bridge. Each skill produces a formula-level spec you can build in Excel without guessing the structure.
DCF Structure Builder
Use when: A company or asset needs intrinsic valuation using discounted cash flow analysis
Output: FCF build table, DCF engine, equity bridge, WACC formula, and two-variable sensitivity table
Sensitivity Matrix Builder
Use when: Base case model is complete and needs to show robustness across a range of assumptions
Output: Data Table setup, input range definitions, conditional formatting rules, and base case highlight guide
Bridge and Waterfall Constructor
Use when: A financial change between two periods needs decomposing into its component drivers
Output: Balanced bridge items table, Excel stacked-bar data structure, and chart formatting instructions
Domain 4 · 3 skills
Strategic Analysis
Use these for the three canonical strategy models: market sizing, competitive benchmarking, and portfolio prioritization. Each produces a structured, auditable Excel output rather than a narrative.
TAM-SAM-SOM Sizing Model
Use when: A business needs a credible, auditable market size estimate for a strategy or investor presentation
Output: Dual-method model (top-down and bottom-up) with driver trees, triangulation summary, and SOM range
Competitive Benchmarking Grid
Use when: A strategy engagement requires a structured multi-dimensional comparison of 5-8 competitors
Output: Normalized scoring grid with heat-map formatting, weighted overall score, and radar chart specification
Portfolio Prioritization Matrix
Use when: Leadership needs to rank competing initiatives against a constrained resource budget
Output: Weighted scoring model, 2x2 scatter plot spec, tier assignments, and cumulative resource allocation check
Domain 5 · 3 skills
Scenario and Risk
Use these after the base case is built. A three-scenario toggle, a tornado chart, and a risk-adjusted expected value are the three tools that convert a point estimate into a defensible range.
Three-Scenario Model
Use when: A model needs to reflect a range of outcomes across Base, Bull, and Bear assumptions
Output: Scenario Inputs tab design, INDEX-MATCH selector formula, and scenario comparison table with deltas
Sensitivity Tornado
Use when: A completed model needs to reveal which assumptions drive the most output uncertainty
Output: Ranked tornado data table, horizontal bar chart structure, and top-3 critical assumption summary
Risk-Adjusted Value
Use when: A decision requires a single probability-weighted number from multiple scenario outcomes
Output: EV calculation, scenario contribution table, P_Bull vs P_Bear sensitivity, and break-even probability
Domain 6 · 3 skills
Executive Reporting
Use these to convert a completed model into a board-ready output. A print-ready summary tab, a recurring KPI dashboard, and an SCQA narrative brief are the three reporting tools a senior audience expects.
Output Summary Tab
Use when: A completed model needs a print-ready single-page executive summary for a board pack
Output: Zone layout, KPI tile designs, narrative block structure, sensitivity summary, and assumption log
KPI Dashboard Structurer
Use when: A leadership team needs a recurring monthly performance tracker in pure Excel, no macros
Output: 8-12 KPI column structure, RAG formulas, INDEX-MATCH period selector, and sparkline setup instructions
SCQA Narrative Wrapper
Use when: Model findings need translating into a structured brief for a senior audience
Output: One-page SCQA brief with Situation, Complication, Question, Answer, supporting points, and next steps
Domain 7 · 3 skills
Modelling OS
Use these to build the invisible infrastructure that makes every model consistent, auditable, and hand-off ready. Architecture, audit, and assumption registry are the three governance tools that separate professional models from analyst spreadsheets.
Model Architecture Template
Use when: Starting any new model and needing a consistent structural shell before content is added
Output: Full tab inventory, color-coding table, number format standards, Checks tab design, and startup checklist
Formula Audit Checker
Use when: An inherited or completed model must be reviewed for errors before sign-off or client presentation
Output: 12-step audit checklist with Excel navigation paths, hardcode detection steps, and audit log structure
Assumption Registry Builder
Use when: A model needs formal documentation of every material assumption for handover or investment approval
Output: Full register column structure, sensitivity rank formula, source quality guide, and sign-off process
Categories 1 to 3 frame the problem, design the data structure, and build the core model. Categories 4 to 6 run the analysis, test the scenarios, and produce the executive output. Category 7 governs the model infrastructure.
Setup Guide
Download the skills pack
The zip contains all 21 skills, one folder per skill. Each skill is a single SKILL.md file. Unzip it anywhere. Keep the whole set, or pull out just the folders you need.
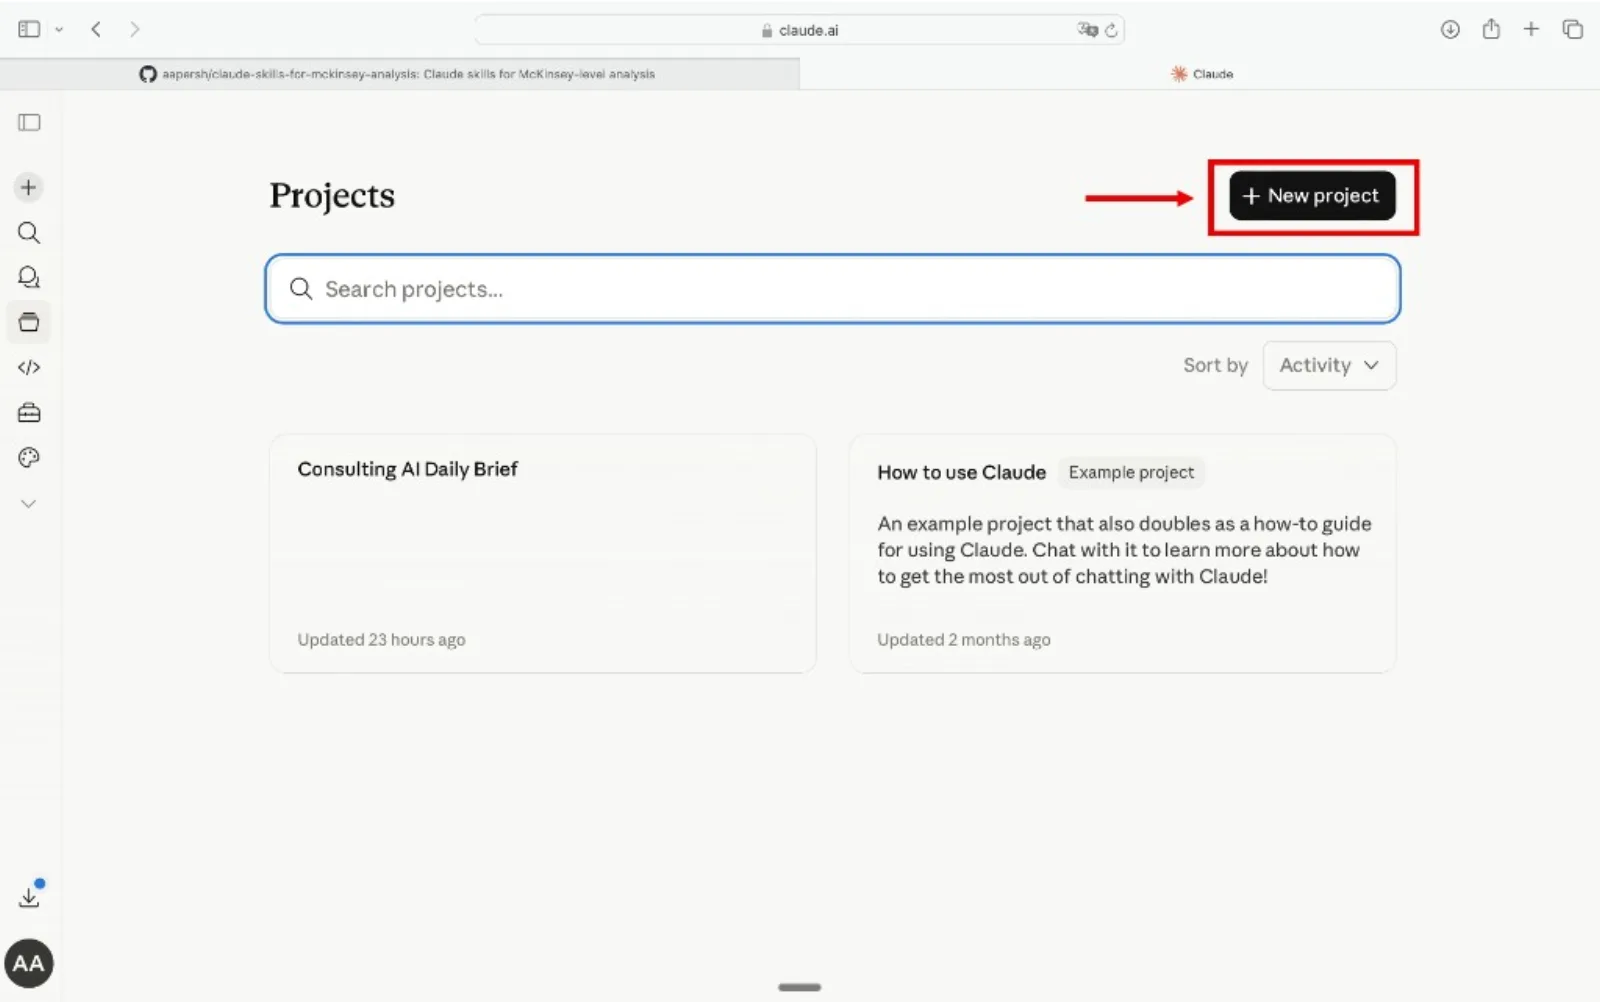
Create a Claude Project
Go to claude.ai, open the left sidebar, click Projects, then Create Project. Name it something like "Strategy Analyst" or "Modelling Assistant" so you can reuse it across engagements.
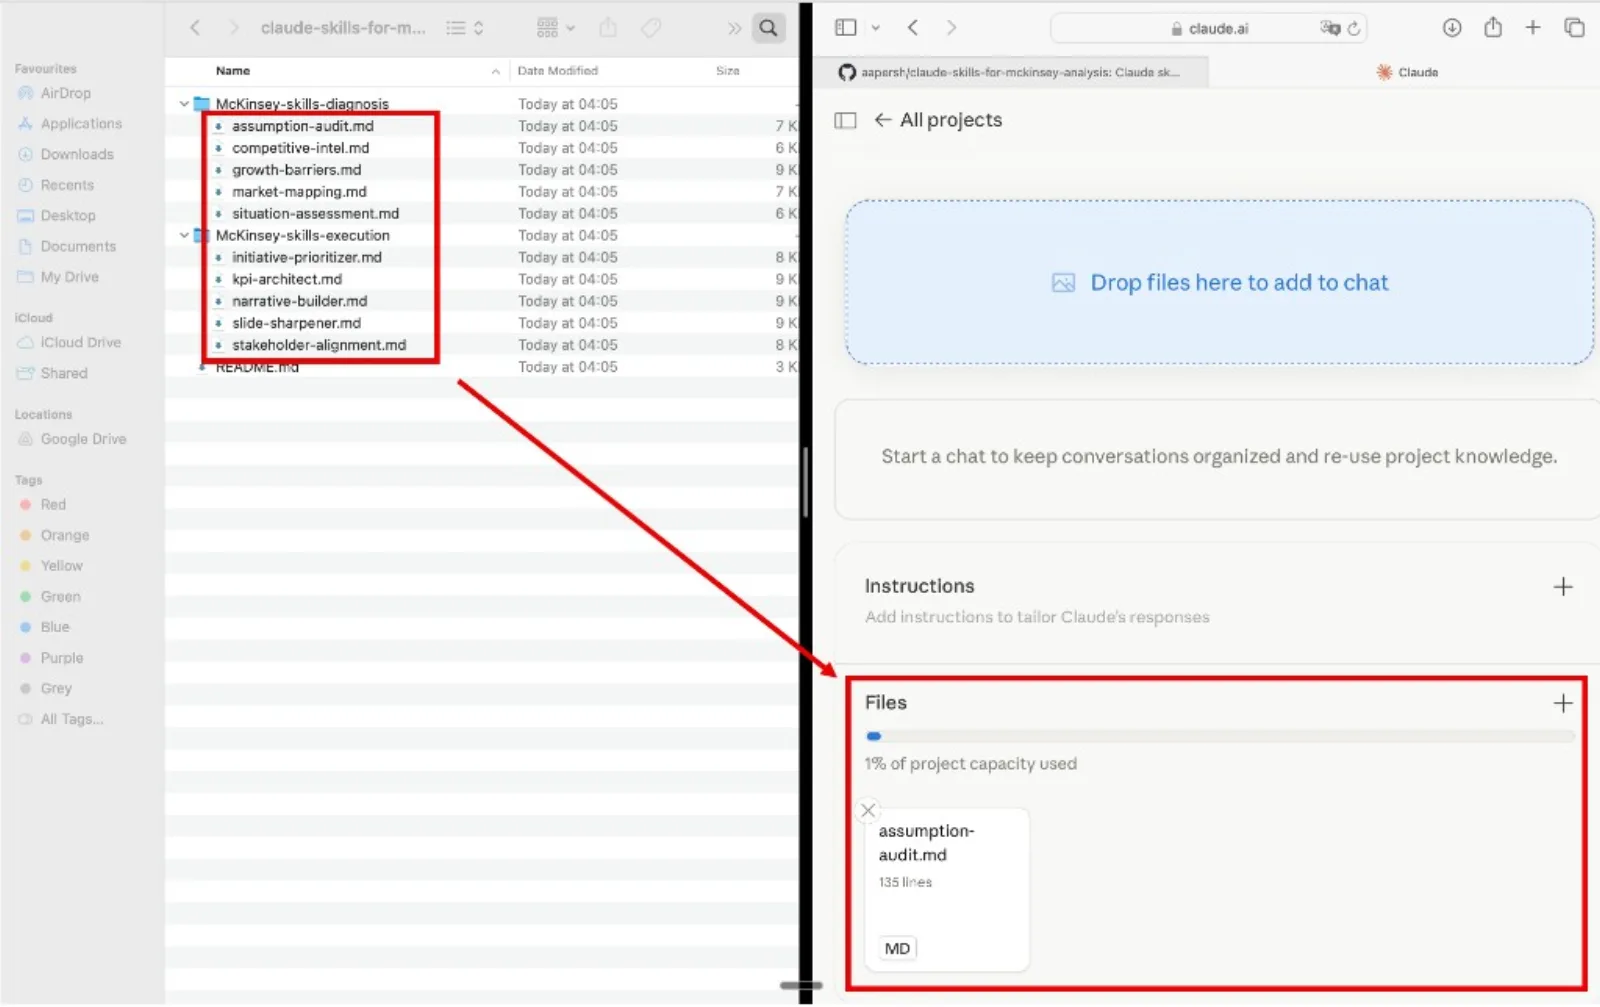
Add the skills as Project Knowledge
Inside your project, open Project Knowledge, click Add Content, and upload the .md files. Add as many as you want, one skill, an entire domain, or all 21. Claude will reference them automatically in every conversation inside that project.
Start using the skills
Open a new conversation inside the project, paste in your data or problem statement, and name the skill you want Claude to run. Claude reads it from project knowledge and runs the analysis with the framework already loaded.
Tip
Refer to the skill by name in your prompt. Phrases like "Use the mece-issue-tree-builder skill" or "Run the dcf-structure-builder skill" point Claude at the right framework instead of leaving it to guess.

Example prompts
- "Use the mece-issue-tree-builder skill to decompose this strategy problem."
- "Use the dcf-structure-builder skill to build a DCF for this business."
- "Use the three-scenario-model skill to stress-test our revenue assumptions."
- "Use the scqa-narrative-wrapper skill to structure these findings for the board."
How to choose an Excel-inspired Claude skill
Skip the directory hunt. Each of these Excel-inspired Claude skills maps to a specific analytical need. Pick the row that matches what you need to do and use that skill. For a wider walkthrough of working this way, see our consultant's guide to Claude.
The quality bar
Every skill is designed to push Claude toward outputs that meet the same partner-grade quality bar, the standard a senior associate would hold each deliverable to before it leaves the room.