
How to Build a Competitive Landscape Slide in PowerPoint
How to pick the two axes, plot competitors as bubbles sized by share, highlight your own company, and the prompts that render an editable native slide for you.
Free skills and prompts for Claude and strategy work
Templates for Claude, ChatGPT and Perplexity — from diagnostics to board-ready decks.

Independent and unaffiliated. The skills and frameworks referenced on this page are not created by, endorsed by, or affiliated with BCG. They are built on publicly available frameworks and ways of working BCG is known for, and are inspired by how those approaches are used to tackle complex business problems.
How to build a competitive landscape slide in PowerPoint
To build a competitive landscape slide in PowerPoint, choose two dimensions that separate the players for the axes, plot each competitor as a bubble placed by its read on both axes, set bubble size to relative market share, highlight your own company in the accent color, and add a short legend that explains the axes and the bubble size. Finish with an action title that states the positioning takeaway. PowerPoint has no native bubble-positioning chart, so you build it from an XY bubble chart or from plotted shapes, and Oria can render the whole thing as an editable native slide from one block of text.
This guide walks the manual build step by step, gives you the exact prompts to draft the axes, cluster competitors, and turn a research memo into the slide, and shows the faster one-prompt route. Everything you need is here. You will not have to leave to get the substance.
What it is and when to use it
A competitive landscape puts every relevant player on one chart so the audience can see, at a glance, who competes, how each is positioned, and how big each one is. Two axes capture the dimensions that matter in the market, each bubble is a competitor, and bubble size carries relative share. The picture answers three questions at once: where are the players clustered, where is the white space, and where do you sit.
Reach for it in market entry decks, due diligence reads, fundraising materials, and strategy reviews, whenever the message is about positioning rather than a single head-to-head. When the message is the structural attractiveness of the industry itself, a Porter's Five Forces slide fits better. When you are sorting a fixed set of options into act-now versus park, a 2x2 positioning matrix slide is the cleaner choice. Use the landscape when the story is the shape of the whole market.
The anatomy of the slide
Five parts carry the whole slide. Get these right and the positioning reads itself.
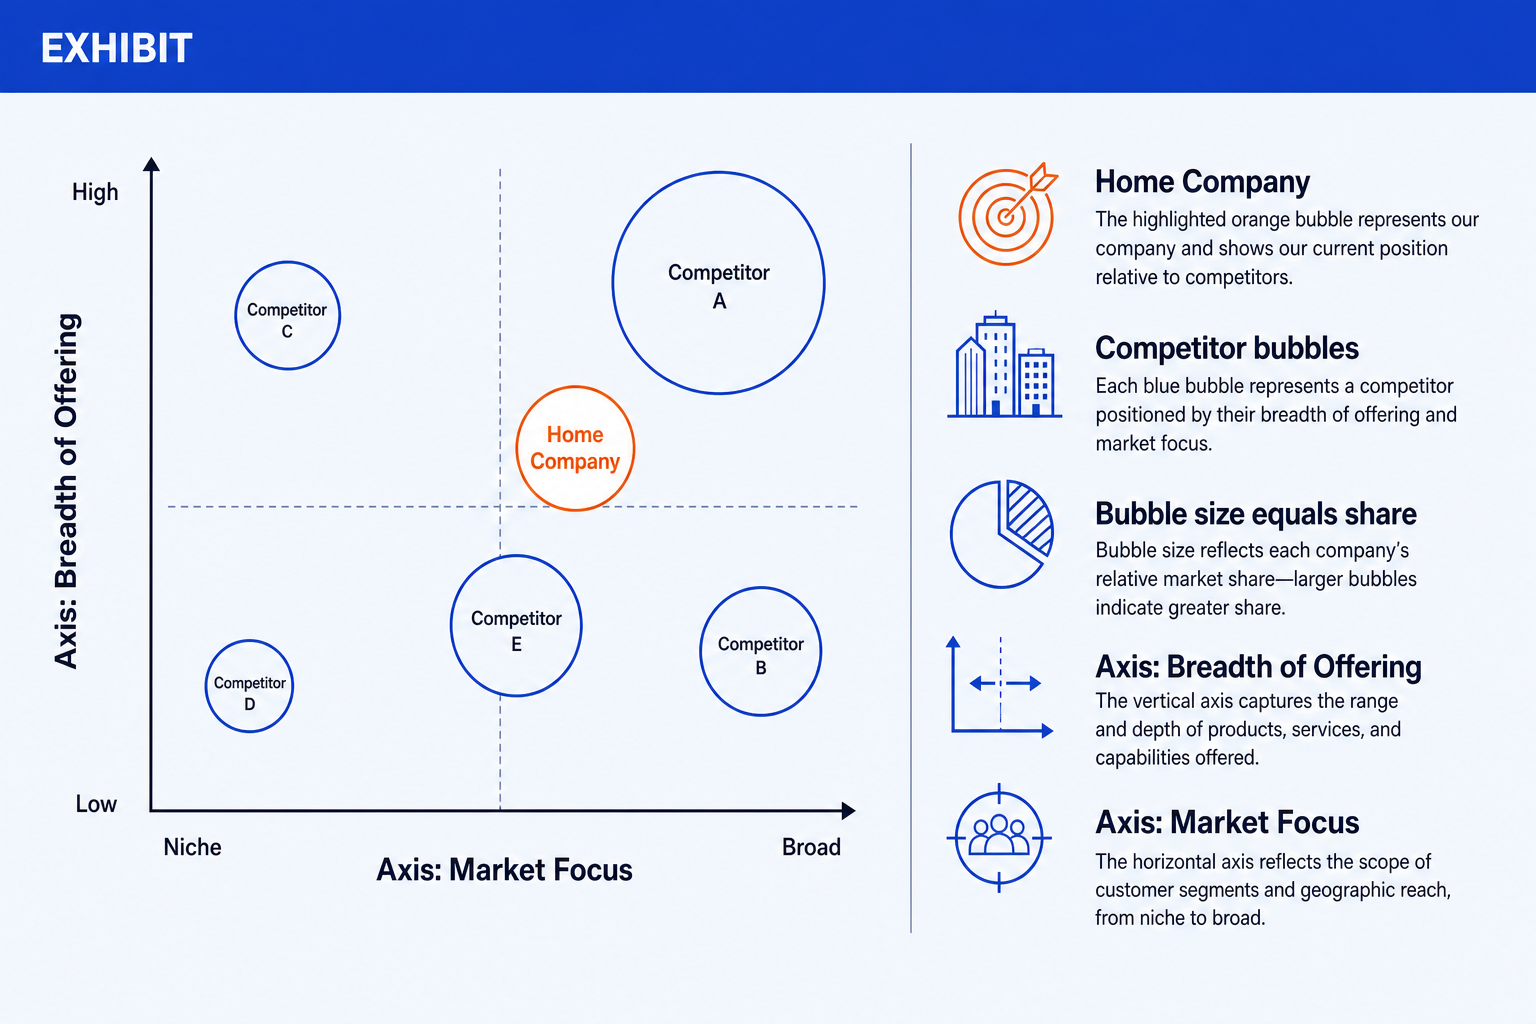
Two axes. Two dimensions that separate the players, each running low to high, for example breadth of offering and market focus. Name them in plain words so the reader knows what each end means.
Competitor bubbles. One bubble per player, placed by its read on both axes. Use a neutral labeled bubble for each competitor rather than a logo so the chart stays clean and brand-safe.
Bubble size as share. Set each bubble's diameter to relative market share, so the big players read as big without a second chart. Keep the scaling consistent and note it in the legend.
Highlighted home company. Your own company in the accent color so the eye lands on where you sit relative to everyone else. This is the one bubble that should stand out.
Legend and title. A short legend that decodes the axes and the bubble size, plus an action title that states the positioning takeaway instead of a topic label.
The step-by-step build
PowerPoint has no native landscape chart. For a label-only version, two crossed axes plus plotted circles are quickest. For a data-driven version, an XY bubble chart sizes the circles by share automatically. The steps below build the clean, presentable version either way.
Pick two differentiating dimensions for the axes. Choose the two dimensions that actually separate the players in this market, for example breadth of offering and market focus. Write each as a low-to-high scale and confirm the two are independent before going further.
Plot the competitors as bubbles. Place a bubble for each player in the position its two reads put it in. Keep the placement honest, a rough low or high is fine, and label every bubble with the company name in plain text rather than a logo.
Set bubble size to relative share. Scale each bubble's diameter to that player's relative market share so size carries a real variable. Hold the scaling consistent across all bubbles and avoid making any so large that it covers its neighbors.
Highlight your own company. Recolor your bubble in the accent so it reads first, and keep every other bubble in a single neutral color. This is the one place emphasis belongs, so resist coloring more than one bubble.
Add a concise legend and align everything. Add a small legend that decodes the axes and the bubble-size rule, then align the axes, the bubbles, and the labels on a clean grid. Replace the topic label with an action title that states the positioning takeaway.
Gotcha
The two axes must be independent, not correlated. If your dimensions move together, for example revenue and headcount, every bubble lands on the diagonal and the chart stops sorting anyone. Pick two dimensions that can vary separately so players spread across the field.
Alternative layouts for the landscape
The bubble-positioning chart is the default, but two other layouts fit different messages. Match the layout to what you want the audience to take away.
Bubble-positioning chart. The default. Two axes, competitors as bubbles, size as share. Best when the story is who sits where and where the white space is.
Positioning 2x2. Drop the bubble sizing and use four named quadrants instead. Best when the message is a clean four-way sort, like challengers versus incumbents. See the 2x2 guide for the build.
Capability grid. Rows are competitors, columns are capabilities, cells are filled or rated. Best when buyers compare on a feature checklist rather than on two strategic axes. Build it as glued grid cards, never a spreadsheet table.
Note
This is a positioning view, not a head-to-head product comparison, so keep to neutral labeled bubbles and skip real competitor logos. Reserve logos for a true versus page where the comparison context is explicit.
The one-prompt route: list the players, get an editable landscape
The crossed axes, the hand-sized circles, and the nudged labels are exactly the kind of mechanical work that eats an evening. Oria removes it. It is an AI add-in that runs in the PowerPoint task pane and produces fully editable native PowerPoint elements in your corporate template. You name the two axes and list each competitor with its position and share, and Oria renders the competitive landscape slide for you, with your own company already highlighted.
Because the output is native, every axis label, bubble, and legend entry stays editable afterward. You can rename an axis, move a player, or resize a bubble without rebuilding anything. The same approach works for any complex slide, from a landscape to a process flow, which is why Oria suits the dense decks consultants and bankers actually ship. See the Claude prompts for competitive analysis for the research side of the workflow.
One-block landscape prompt for Oria
The prompts that build the landscape
These are the exact copy-paste prompts we use to draft the axes, cluster the competitors, turn a research memo into the slide, and set the emphasis. The build prompts are for Oria inside PowerPoint; the analysis prompts are for Claude before you build. Replace the bracketed parts with your own market.
Draft the axes and clusters in Claude first
Draft two differentiating axis dimensions
Cluster competitors into positioning groups
Turn a research memo into the slide inputs
Build the slide in Oria
Spec the axes and plot the bubbles
Highlight your company and add the legend
Tip
Settle the axes, the clusters, and the share numbers in Claude, then hand the clean list straight to Oria. For the full draft-to-deck method, see the consultant's guide to Claude.
Common mistakes to avoid
When the share story matters more than positioning, a BCG growth-share matrix slide is the right tool. Match the framework to the message.
Frequently asked questions
What is a competitive landscape slide used for?
A competitive landscape slide shows who competes in a market, how each player is positioned, and how big each one is relative to the others. Strategy teams, consultants, and bankers use it in market entry decks, due diligence reads, and board reviews to show where the home company sits and where the white space is. The point of the slide is the positioning story, not a list of logos.
What goes on a competitive landscape slide?
The core is a positioning chart with two labeled axes that capture the dimensions that matter in the market. Each competitor is a bubble placed by its read on both axes, with bubble size set to relative share. Your own company is highlighted in the accent color. A short legend explains what the axes and the bubble size mean, and an action title states the takeaway.
How do I choose the two axes?
Pick two dimensions that genuinely separate the players and that vary independently of each other, for example breadth of offering versus market focus, or price point versus service model. If the two axes move together, every bubble lands on a diagonal and the chart stops sorting anyone. Test the pair on three or four known competitors before you commit to it.
Should I use real competitor logos on the slide?
On an internal strategy or positioning slide, neutral labeled bubbles read more cleanly and avoid brand and trademark questions. Reserve real logos for a genuine head-to-head product comparison page where fair-use context is clear. For a landscape view, a labeled bubble per competitor with your own company in the accent color is the house-style choice.
What is the fastest way to build a competitive landscape slide?
Name the two axes, list each competitor with its read on both axes and its relative share, and let Oria render it. You get a fully editable native PowerPoint slide in your template, with the axes, the bubbles sized by share, your highlighted company, and the legend already placed. You skip the manual scatter setup and the hand-sized circles entirely.