
How to Build a Market Sizing Slide with TAM SAM SOM
What TAM, SAM, and SOM show, top-down versus bottom-up with triangulation, the step-by-step manual build, the prompts that make it defensible, and the one-line route that renders an editable native slide for you.
Free skills and prompts for Claude and strategy work
Templates for Claude, ChatGPT and Perplexity — from diagnostics to board-ready decks.
How to build a market sizing slide
To build a market sizing slide, frame the opportunity as TAM, SAM, and SOM: the total addressable market, the serviceable addressable market, and the serviceable obtainable market. Size it two ways, top-down from a published figure and bottom-up from unit economics, then triangulate so the numbers agree. Lay the three figures out as a nested funnel or concentric rings that narrow to the share you can win, show your assumptions beside each, and write an action title that states the so-what. Oria can render the whole layout as an editable native slide from one line of text.
This guide walks the manual build and its real gotchas, gives you the exact prompts to size the market and write the title, and shows the faster one-prompt route. Everything you need is here. You will not have to leave to get the substance.
What a market sizing slide is and when to use it
A market sizing slide answers two questions at once: how big is the opportunity, and how much of it can you realistically win. It does this by narrowing from the broadest universe of demand down to your obtainable share, usually through the TAM, SAM, SOM framework. The point of the slide is the logic of the narrowing, not just the three numbers, so the assumptions behind each step have to be visible.
Reach for it whenever you need to justify the scale of a prize. Investment memos, pitch books, strategy reviews, business cases, and fundraising decks all open with market sizing because every later recommendation rests on it. It is a staple of consulting and banking work because a credible number, triangulated and sourced, earns the right to make a bold ask. For a structured framework slide such as a strengths and weaknesses view, a SWOT analysis slide is the better fit; use market sizing when the message is the size of the opportunity.
TAM, SAM, and SOM explained
Three nested figures carry the whole slide. Each is a subset of the one above it, and each needs a stated assumption beside it so the audience can follow the logic.
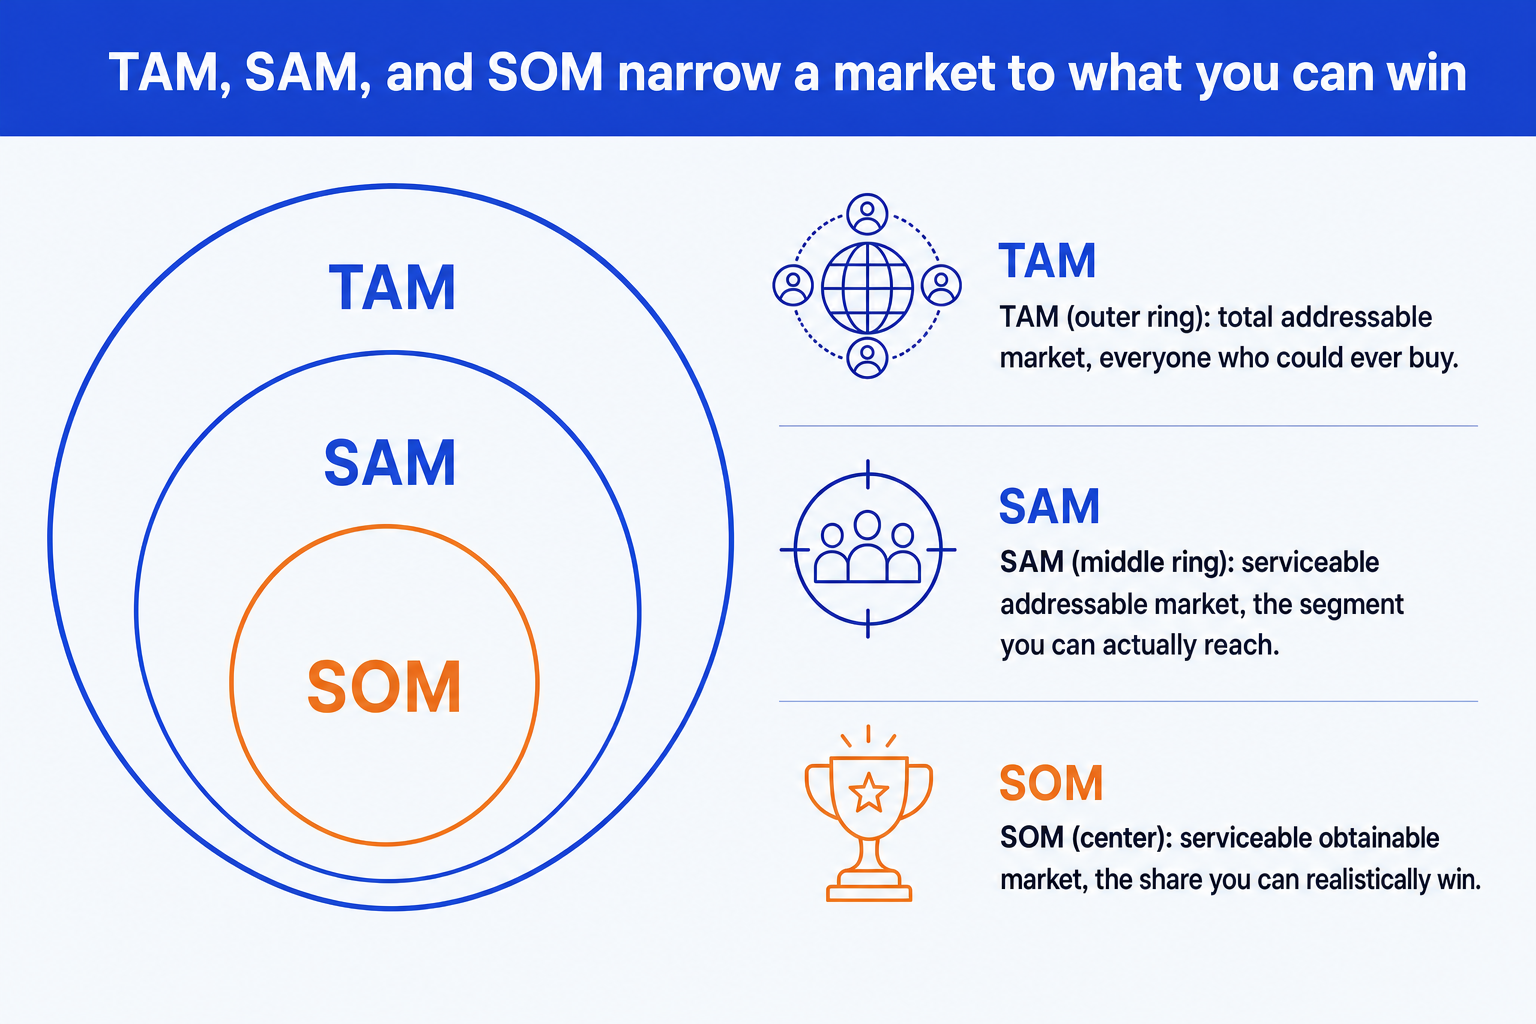
TAM, total addressable market. The full revenue available if every potential buyer in the category purchased. The outer ring, anchored to a credible top-line figure so the audience knows the universe you started from.
SAM, serviceable addressable market. The slice of TAM you can actually reach given your product, target segment, and geography. State the filters that shrank TAM to SAM so the step is auditable.
SOM, serviceable obtainable market. The share of SAM you can realistically win in a defined period, given competition, capacity, and go-to-market. This is the number the slide should land on, so give it the emphasis color.
Assumptions, beside each figure. A one-line note under each ring naming the source and the filter applied. This is what turns a guess into a defensible estimate the audience can trust.
Top-down vs bottom-up, and triangulation
There are two ways to size a market, and the strongest slide uses both, then reconciles them. One method alone is a single point estimate; two methods that agree are a defensible range.
Top-down
Start from a published market figure and narrow it with segment, geography, and product filters until you reach SAM and SOM. Fast and easy to communicate, but only as credible as the source figure, so name it on the slide.
Bottom-up
Build from unit economics: the number of target customers times average price times purchase frequency. More work and more data-hungry, but far harder for a partner or investor to poke holes in because every input is yours to defend.
Triangulation
Run both methods and compare. If they land close, confidence rises and you can show a range. If they diverge, you have found a flawed assumption worth fixing before anyone else does. Always show the cross-check rather than a lone number.
The step-by-step manual build, with the real gotchas
The classic layout is a nested funnel or three concentric rings that narrow from TAM to SOM. Build it from native shapes so every element stays editable, and keep the assumptions visible beside each figure.
Define the market boundary first. Write one sentence naming exactly what you are sizing: which product, which buyers, which geography, which year. A fuzzy boundary makes every number below it meaningless.
Size TAM, SAM, and SOM two ways. Estimate each figure top-down from a published source and bottom-up from unit economics. Record the inputs for both so you can show the cross-check, not just the result.
Lay out the nesting. Draw three stacked funnel bands or three concentric rings, largest for TAM and smallest for SOM, so the eye reads the narrowing in one glance. Keep the spacing even and the alignment clean.
Label each figure with its value and unit. Put the number on each band or ring, in the same unit and the same year, so the audience is never converting in their head.
Show the assumptions beside each step. Add a short note under each figure naming the source and the filter applied. This is the difference between a number people trust and one they discount.
Write the action title. Replace the topic label with a full-sentence so-what, leading with the obtainable share and why it is worth pursuing. The title is the slide; the funnel is the proof.
Gotcha
Always show your assumptions and triangulate two methods. A single point estimate with no source is the fastest way to lose the room. Size the market top-down and bottom-up, put both numbers and their inputs on or beside the slide, and explain any gap between them before you are asked.
The one-prompt route: describe the market, get an editable slide
Aligning three nested rings, balancing the assumption notes, and keeping the emphasis on SOM is exactly the kind of mechanical work that eats an evening. Oria removes it. It is an AI add-in that runs in the PowerPoint task pane and produces fully editable native PowerPoint elements, including the funnel shapes and text, in your corporate template. You describe the market in one line and Oria renders the market sizing slide for you.
Because the output is native PowerPoint, every ring, label, and note stays editable afterward. You can swap a figure, rename a segment, or recolor the emphasis without rebuilding anything. The same approach works for any complex slide, from a funnel to a process flow, which is why Oria suits the dense decks consultants and bankers actually ship. See the Claude skill for slide design for the storyline side of the workflow.
One-line market sizing prompt for Oria
The prompts that make the market sizing slide defensible
These are the exact copy-paste prompts we use to size the market, lay out the framework, and write the title. The first three are for Oria inside PowerPoint; the last two are for sizing the market in Claude before you build. Replace the bracketed parts with your own figures.
Build the slide in Oria
Spec the TAM, SAM, SOM layout
Add the assumptions and the cross-check
Choose the emphasis and write the title
Size the market in Claude first
Size top-down and bottom-up, then triangulate
Sharpen the action title
Tip
Size and triangulate the market in Claude, then hand the clean TAM, SAM, and SOM figures and their assumptions straight to Oria. For a numeric bridge instead of a funnel, see how to build a waterfall chart slide.
Common mistakes to avoid
For the wider habits that make AI-built slides look board-ready rather than generic, the consultant's guide to Claude covers the end-to-end method from analysis to deck.
Frequently asked questions
What is a market sizing slide?
A market sizing slide quantifies how big an opportunity is and how much of it you can realistically win. It usually frames the market as TAM, SAM, and SOM: the total addressable market, the serviceable addressable market, and the serviceable obtainable market. The slide shows the three figures narrowing from the broadest universe of demand down to the share you can capture, with the method and assumptions visible so the audience trusts the number.
What is the difference between TAM, SAM, and SOM?
TAM is the total addressable market, the full revenue available if every potential buyer purchased. SAM is the serviceable addressable market, the slice of TAM you can reach given your product, segment, and geography. SOM is the serviceable obtainable market, the share of SAM you can realistically win in a defined period given competition and capacity. Each figure is a subset of the one above it, so the three nest inside each other.
Should I size the market top-down or bottom-up?
Use both and reconcile them. Top-down starts from a published market figure and narrows it with segment filters; it is fast but only as good as the source. Bottom-up builds from unit economics, the number of target customers times price times frequency; it is more defensible but data-hungry. The strongest market sizing slide triangulates the two methods and shows that they land within a reasonable range of each other.
What is triangulation in market sizing?
Triangulation means estimating the same market with two or more independent methods and comparing the results. If a top-down estimate and a bottom-up estimate land close together, confidence rises. If they diverge, you have found a flawed assumption to investigate. Showing both numbers on the slide, with the gap explained, is far more persuasive than a single point estimate with no cross-check.
What is the fastest way to build a market sizing slide?
Describe the structure in one line and let Oria render it. You give the TAM, SAM, and SOM labels and the assumptions behind each, and Oria builds a fully editable native PowerPoint slide in your template, including the nested funnel or concentric layout and the supporting notes. You skip the manual shape alignment and the connector work entirely.