
How to Build an Editable SWOT Analysis Slide in PowerPoint
A clean four-quadrant layout, parallel and balanced phrasing, a cross-read that turns the boxes into a recommendation, and the copy-paste prompts that build the whole slide from rough notes in one pass.
Free skills and prompts for Claude and strategy work
Templates for Claude, ChatGPT and Perplexity — from diagnostics to board-ready decks.
How to build a SWOT analysis slide, in short
To build a SWOT analysis slide in PowerPoint, draw a clean two-by-two grid, then label the quadrants Strengths, Weaknesses, Opportunities, and Threats. The top row is internal to your organization, the bottom row is external; the left column is helpful, the right column is harmful. Put three to five parallel, action-titled points in each box, keep the four quadrants balanced and on brand, and finish with a cross-read that turns the matrix into a recommendation. Build it from native shapes so it stays editable, or describe it once to Oria and let it render the slide in your template.
What a SWOT is and when to use it
A SWOT is a structured snapshot of where something stands. It sorts what you know into two splits at once. The vertical split is internal versus external: Strengths and Weaknesses sit inside your control, while Opportunities and Threats live in the market around you. The horizontal split is helpful versus harmful: Strengths and Opportunities push you forward, while Weaknesses and Threats hold you back.
Reach for one when you need a fast, shared view before a bigger decision: a strategy offsite, a market-entry call, a deal screen, a new product line. It is a framing tool, not the answer. Its job is to get the team looking at the same four boxes so the conversation moves to the cross-reads and the so-what.
Tip
The fastest sanity check on any item: ask "is this inside my control or outside it?" and "does this help or hurt?" The two answers place it in exactly one quadrant. If it could go in two, it is written too loosely.
The four-quadrant build, done right
Most SWOT slides fail not on the grid but on the contents. Four rules separate a slide that reads like analysis from one that reads like a brainstorm dump.
Balance the quadrants. Aim for a similar number of points in each box, three to five. A SWOT with seven strengths and one threat reads as advocacy, not assessment, and a reviewer will not trust it.
Write parallel points. Within a quadrant, start every point the same way: all noun phrases, or all verbs. Parallel phrasing makes the box skimmable and signals disciplined thinking.
Lead with the message, not the topic. "Lowest unit cost in the segment" beats "Cost." Each point should state a fact a partner could say out loud, not a category header.
Keep it editable and on brand. Build from native shapes and text boxes on your template colors and fonts, never a pasted screenshot. The slide must survive a brand-compliance review and a last-minute edit.
The quadrants in detail, so each box does its own distinct job:
Internal advantages you can build on: cost position, brand, talent, technology, distribution, balance sheet.
Internal gaps you must manage: capability holes, legacy systems, thin margins, concentration risk.
External openings worth pursuing: new segments, regulation shifts, channel changes, unmet demand.
External risks to plan against: new entrants, substitutes, pricing pressure, supply or policy shocks.
The same discipline shows up on adjacent slide types. If your story needs a quantitative bridge or a structure chart next, the build rules carry over to a waterfall chart slide or an org chart slide: balanced parts, parallel labels, lead with the message, keep it native and editable.
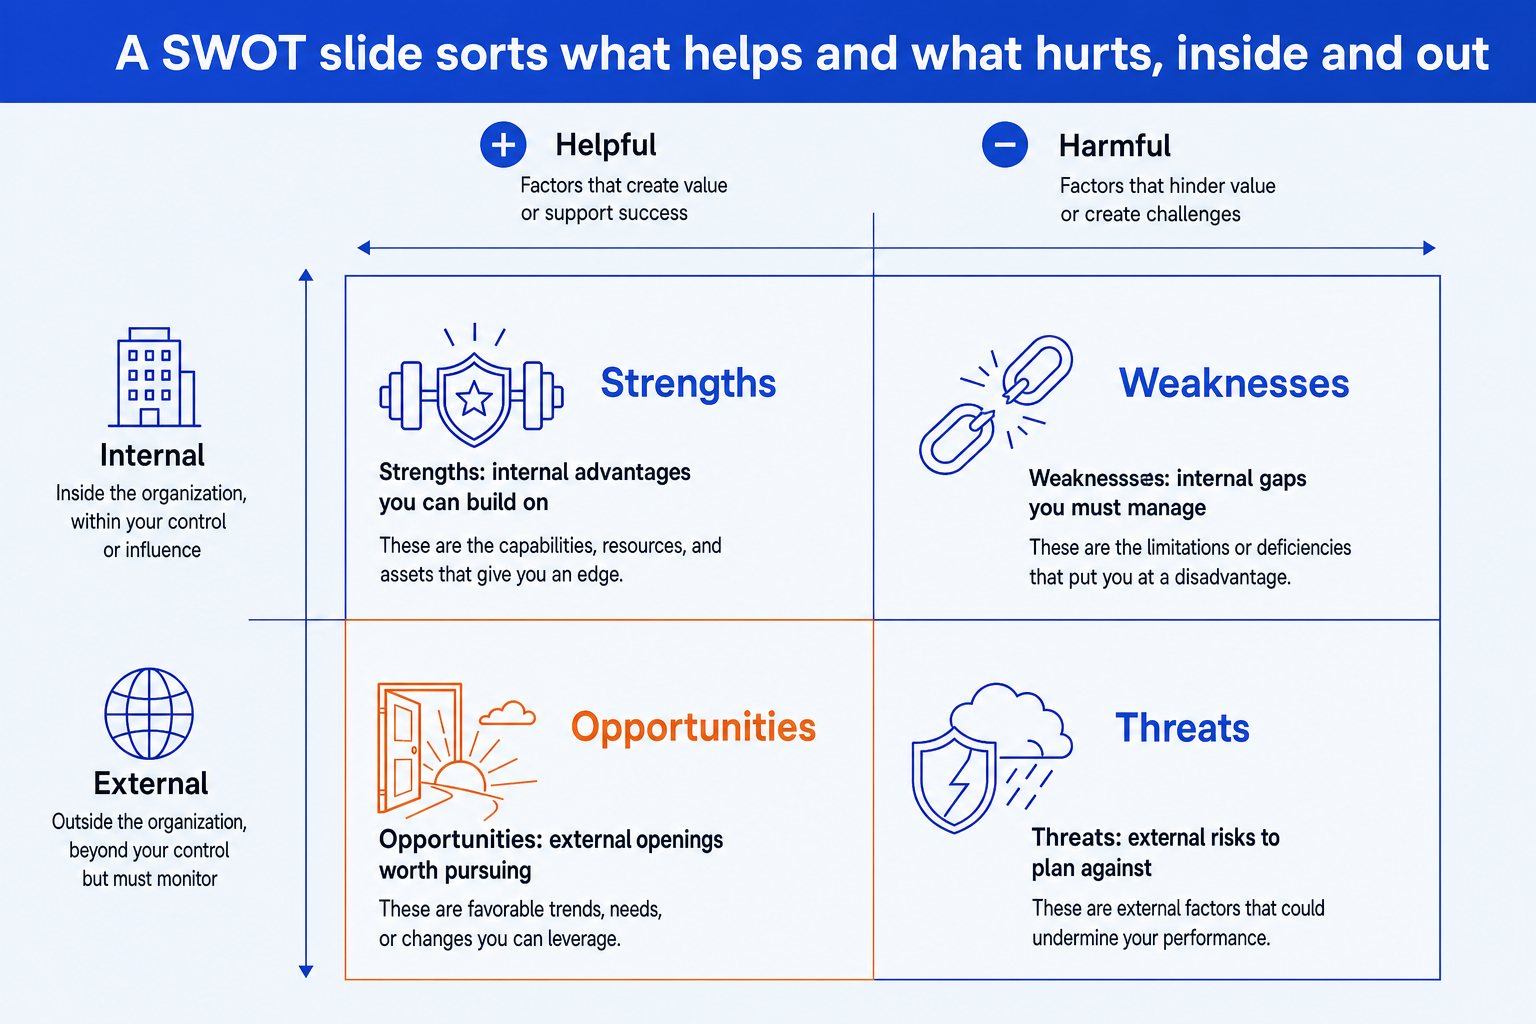
The 2x2 SWOT, laid out
This is the structure you are aiming for. The vertical axis splits internal from external, the horizontal axis splits helpful from harmful, and each quadrant carries one icon and a one-line descriptor so the slide communicates at a glance.
The one-prompt Oria route
You do not have to draw four boxes by hand. Open Oria in the PowerPoint task pane, describe the SWOT in one line through Text to Slide, and it renders a clean 2x2 in your template as native PowerPoint elements you can still edit. Three steps:
Describe the slide in one prompt: name the four quadrants and paste three to five points into each.
Pick from the design options Oria returns, then prompt for a tweak if a quadrant needs more or less density.
Edit on the slide. Every shape, label, and icon is native PowerPoint, on your fonts and colors, ready for a recolor or a last-minute change.
Because the output is editable native shapes rather than a flat image, you keep full control after generation. For the broader pattern of moving from analysis to slides, see the consultant's guide to Claude.
Copy-paste prompts for the SWOT
These are the exact prompts that do the work, run in sequence in one Claude conversation so each builds on the last. The first drafts the four quadrants from raw notes, the second sharpens them into action-titled points, the third turns the matrix into a recommendation, and the last two clean up balance and produce the one-line build prompt for Oria.
Step 1: Draft the four quadrants from notes
Sort notes into a SWOT
Step 2: Sharpen into action-titled points
Make every point lead with the message
Balance the quadrants
Step 3: Turn the SWOT into a so-what
Cross-read into a recommendation
Step 4: Build the slide in one line
One-prompt build for Oria
Tip
Run steps one through three in Claude to get clean, balanced, action-titled content, then paste step four into Oria. The thinking stays with the model that is good at it; the slide gets built by the tool that keeps it editable and on brand.
Common mistakes to avoid
Frequently asked questions
What goes in each quadrant of a SWOT analysis slide?
Strengths and Weaknesses are internal: capabilities, assets, cost position, talent, and brand that sit inside your control. Opportunities and Threats are external: market shifts, regulation, competitor moves, and demand changes that you do not control. The vertical split is internal versus external; the horizontal split is helpful versus harmful. If an item belongs in two places, it usually means it is written too vaguely. Sharpen it until it lands in exactly one quadrant.
How many points should each quadrant have?
Three to five points per quadrant. Fewer than three looks thin and suggests you stopped thinking. More than five turns the slide into a wall of text no executive will read. If a quadrant is overflowing, group the points into themes and promote the strongest three. Balance matters too: a SWOT with eight strengths and one threat reads as a sales pitch, not analysis.
Should a SWOT analysis slide lead to a recommendation?
Yes. A SWOT that only lists four quadrants is a description, not a decision. The value comes from the cross-reads: use a strength to capture an opportunity, fix a weakness before a threat exploits it. End the slide, or the slide right after it, with a clear so-what that turns the four boxes into two or three moves the team should make.
How do I keep the slide editable and on brand?
Build the four quadrants from native PowerPoint shapes and text boxes, not a pasted image or a screenshot of a matrix. Keep them on your master slide colors and fonts so the slide passes brand review. The fastest way to get an editable, on-brand version is to describe the SWOT to Oria, which renders it as native PowerPoint elements in your template that you can still move, edit, and recolor.
What is the difference between a SWOT and a TOWS matrix?
A SWOT names the four quadrants. A TOWS matrix takes the next step and pairs them: strengths with opportunities, weaknesses with threats, and so on, to generate strategies. If a reviewer asks you to make the SWOT actionable, you are really being asked to do the TOWS cross-read and surface the resulting moves on the slide.