
How to Build a Prioritization Heatmap Slide in PowerPoint
How to score initiatives on impact and effort, color-code the grid so the quick wins pop, choose a 2x2 over a full heatmap, and the prompts that render an editable native slide for you.
Free skills and prompts for Claude and strategy work
Templates for Claude, ChatGPT and Perplexity — from diagnostics to board-ready decks.
Independent and unaffiliated. The skills and frameworks referenced on this page are not created by, endorsed by, or affiliated with BCG. They are built on publicly available frameworks and ways of working BCG is known for, and are inspired by how those approaches are used to tackle complex business problems.
How to build a prioritization heatmap slide in PowerPoint
To build a prioritization heatmap slide in PowerPoint, set a scoring rubric for two dimensions, usually impact and effort, score every initiative on that rubric, then lay the initiatives on an impact versus effort grid and shade each cell or zone by priority. Color the high-impact, low-effort quick wins with your strongest accent so the eye lands there first, and write an action title that states what to do next. PowerPoint has no native heatmap, so you build it from a colored table or a grid of shapes, and Oria can render the whole thing as an editable native slide from one line of text.
This guide gives you the scoring rubric, the manual build and its real gotcha, the exact prompts to score and plot the initiatives, and the faster one-prompt route. Everything you need is here. You will not have to leave to get the substance.
What a prioritization heatmap is and when to use it
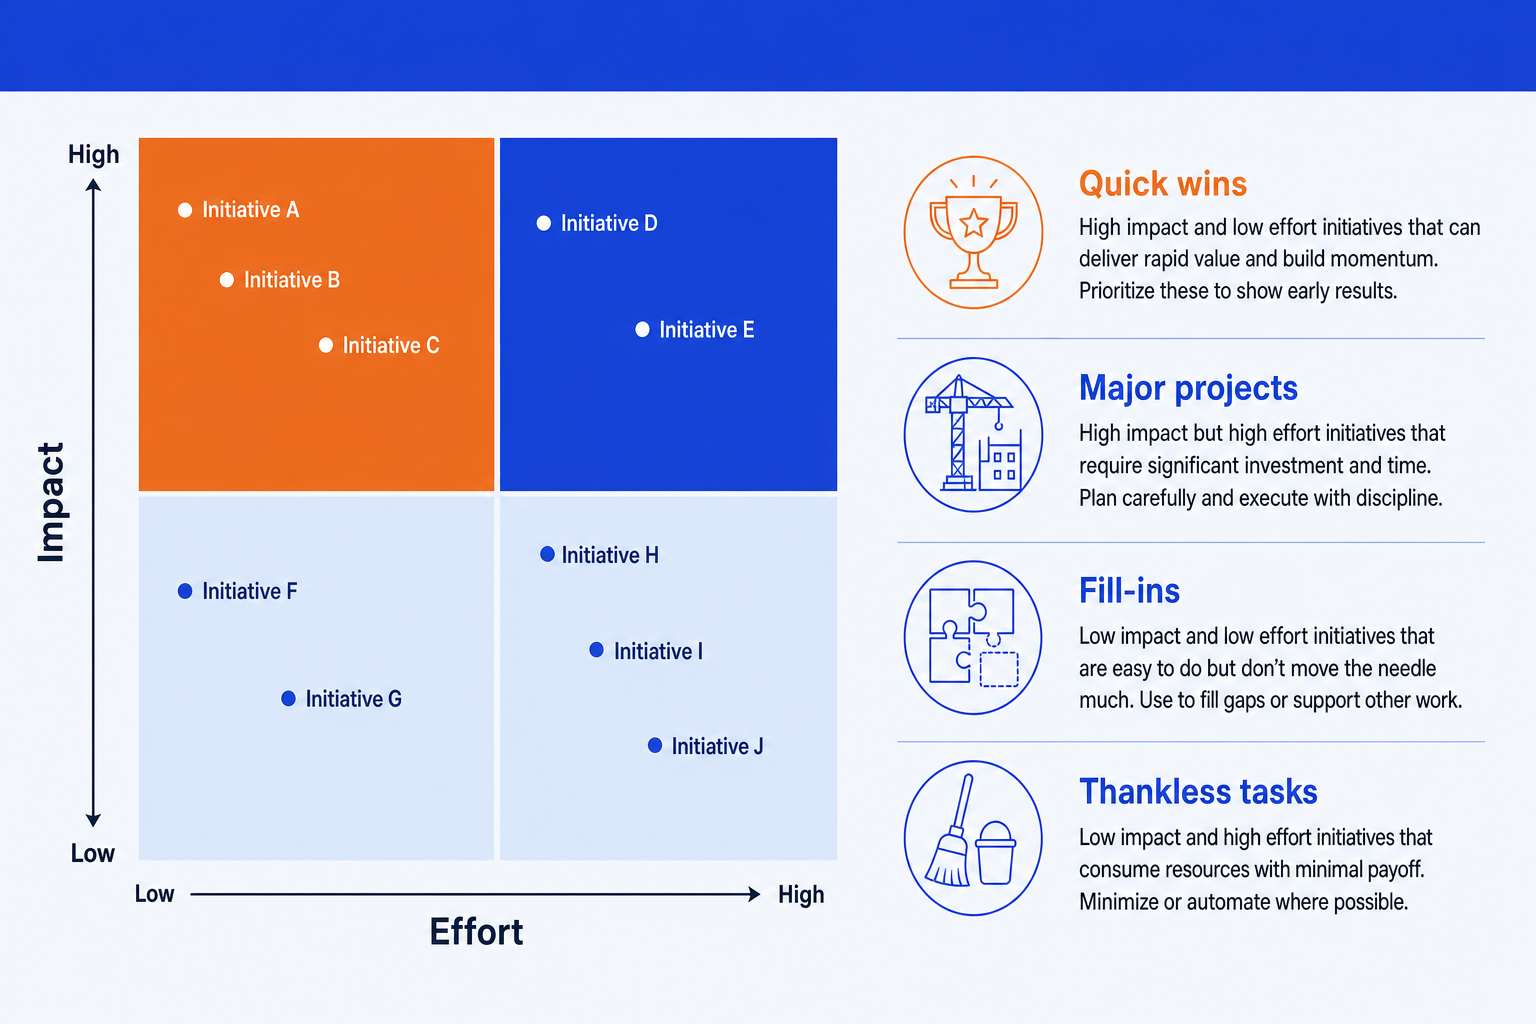
A prioritization heatmap turns a backlog into a decision. You score each initiative on two dimensions that drive sequencing, plot them on an impact versus effort grid, and let color do the ranking. The high-impact, low-effort corner is the quick wins zone. The high-impact, high-effort corner holds the major projects worth planning. Low-impact items either fill spare capacity or get cut.
Reach for it when you have a list of competing initiatives and a stakeholder who needs to agree on what happens first. Roadmap planning, transformation programs, product backlogs, and cost-out portfolios all benefit. It is a sequencing tool, not a data chart, so the value is in honest scores and a clean color scale. For a single recommendation between a handful of options on two criteria, a 2x2 positioning matrix slide is the lighter tool; use the heatmap when you are ranking many items at once.
The anatomy of a prioritization heatmap slide
Four parts carry the whole slide. Get these right and the heatmap reads itself.
Two axes. A horizontal Effort axis and a vertical Impact axis, each running low to high. Name them in plain words and keep the scale consistent so a reader knows what high means.
Color-coded zones. The four quadrants of the grid, each a combination of high and low. Shade them on a single sequential scale so priority reads as intensity, not as a rainbow of unrelated colors.
Plotted initiatives. The items you are ranking, placed as labeled dots by their impact and effort scores. Keep dots one size unless a third variable genuinely needs a bubble.
Quick wins zone. The high-impact, low-effort corner, where the most attractive initiatives sit. Give it the emphasis color so the slide lands on what to do first.
The scoring rubric that makes the heatmap defensible
Color is persuasive, so the scores behind it have to be honest. Fix a simple rubric before you shade a single cell. A 1 to 5 scale on each axis, with a one-line definition per level, is enough for most rooms. Keep the rubric visible so the audience can see how the colors were earned.
Impact 5
Moves a board-level metric on its own.
Impact 3
Meaningful gain for one function or region.
Impact 1
Minor or hard-to-attribute benefit.
Effort 5
Multi-quarter, cross-team, new budget.
Effort 3
One team, a few weeks, known scope.
Effort 1
Days of work with tools you already have.
Tip
Score impact and effort separately, and never let one bleed into the other. The whole point of the grid is to show that some high-impact items are cheap and some are expensive. Conflate the two and the heatmap stops telling you anything.
The step-by-step manual build, with the real gotcha
PowerPoint has no heatmap type. For a zoned grid, two crossed lines plus shaded quadrants and plotted shapes are quickest. For a denser scored grid, a colored table with conditional shading copied from Excel works. The steps below build the clean, presentable version either way.
Set the rubric and score. Define impact and effort on a fixed scale, then score every initiative against it. Settle the numbers before you draw anything so the colors are defensible later.
Draw the grid and the frame. Place an Effort axis across the bottom and an Impact axis up the side, cross them at the midpoint into four equal zones, and add a light outer frame so the field is contained.
Shade the zones on one scale. Pick a single sequential color scale, light to dark, and shade the four zones by priority. Keep the legend short so the reader never has to decode the palette.
Plot the initiatives. Drop a labeled dot for each item in the zone its two scores put it in. Keep dots one size and one color, and nudge overlapping labels so none collide.
Emphasize the quick wins and write the title. Give the high-impact, low-effort zone and the items in it the emphasis color, then replace the topic label with an action title that states the sequence you recommend.
Gotcha
The color scale must be sequential, not a traffic-light grab bag. If you assign red, yellow, blue, and green to the four zones at random, the reader reads the colors as categories rather than priority and the ranking is lost. Use one hue from light to dark, or a single green-to-red scale tied to priority, and stop there.
When to use a 2x2 versus a full heatmap
Both live on the same two dimensions. The difference is how many items you have and how much detail the room needs. Pick the lighter form whenever it carries the message.
Use a 2x2
Under ten initiatives, one decision, and the quadrant is the whole story. The four zones do the ranking and you can label each dot without crowding. Cleaner and faster to read for a single recommendation.
Use a full heatmap
A longer backlog scored on several criteria, where each cell needs its own shade. Rows are initiatives, columns are criteria, and color shows the score per cell. It scales where a 2x2 would turn into a cloud of dots.
If the items are time-phased rather than ranked, neither form fits. A strategy roadmap slide is the better tool for showing what happens in which quarter. Match the framework to the message.
The one-prompt route: list the scores, get an editable heatmap
The shaded zones, the hand-placed dots, and the nudged labels are exactly the kind of mechanical work that eats an evening. Oria removes it. It is an AI add-in that runs in the PowerPoint task pane and produces fully editable native PowerPoint elements in your corporate template. You name the two axes, list the initiatives with their scores, and Oria renders the prioritization heatmap slide for you.
Because the output is native, every axis label, zone color, and plotted dot stays editable afterward. You can rescore an item, move it, or recolor the quick wins zone without rebuilding anything. The same approach works for any complex slide, from a heatmap to a process flow, which is why Oria suits the dense decks consultants and bankers actually ship. See the BCG growth share matrix guide for a related two-dimensional framework.
One-line prioritization heatmap prompt for Oria
The prompts that make the prioritization heatmap sharp
These are the exact copy-paste prompts we use to score the backlog, build the grid, and set the emphasis. The first three are for Oria inside PowerPoint; the last two are for setting the rubric and scoring in Claude before you build. Replace the bracketed parts with your own initiatives.
Build the heatmap in Oria
Spec the grid and the zones
Plot the scored initiatives
Emphasize the quick wins and set the title
Set the rubric and score in Claude first
Define the scoring rubric
Score the backlog and name the zones
Tip
Settle the rubric and scores in Claude, then hand the clean axis names, zone labels, and scored initiatives straight to Oria. For the full draft-to-deck method, see the consultant's guide to Claude.
Common mistakes to avoid
When the message is a single choice between a few options rather than a ranking of many, drop back to a 2x2 positioning matrix slide and keep the field clean.
Frequently asked questions
What is a prioritization heatmap slide?
A prioritization heatmap slide ranks a list of initiatives against two scoring dimensions, usually impact and effort, and uses color to show where each one lands. It lets a board or steering committee see, at a glance, which items to do first, which to schedule, and which to drop. The color is the message: the eye goes straight to the high-impact, low-effort cells.
What is the difference between a 2x2 and a full heatmap?
A 2x2 plots items into four quadrants on two axes and is best for a short list where the quadrant is the whole story. A full heatmap is a grid of rows and columns, each cell shaded by a score, and it scales to many initiatives across several criteria. Use the 2x2 when you have under ten items and one decision; use the heatmap when you are scoring a longer backlog on multiple factors.
How do I score initiatives for a prioritization heatmap?
Set a simple rubric before you plot anything. Score each initiative for impact and effort on a fixed scale, for example 1 to 5, with a one-line definition for each level so the scores are defensible. Keep the rubric on the slide or in the appendix so the audience can see how the colors were earned. Consistent scoring is what separates a credible heatmap from a colored guess.
What colors should a prioritization heatmap use?
Use one sequential scale, not a rainbow. A single hue running from light to dark, or a green-to-red scale tied to priority, reads instantly. Reserve your strongest accent for the quick wins so the most attractive cells pop. Avoid more than three or four shades, and keep the legend short so the reader never has to decode the palette.
What is the fastest way to build a prioritization heatmap slide?
List your initiatives with an impact and effort score for each, name the four zones, and let Oria render it. You get a fully editable native PowerPoint slide in your template, with the grid, the color scale, the plotted initiatives, and the legend already placed. You skip the manual cell shading and the hand-aligned labels entirely.