
How to Build a Cost Synergy Bridge Slide in PowerPoint
How the bridge walks from baseline cost to target, the MECE synergy buckets that carry it, the exact copy-paste prompts that build it, the mistakes that sink it, and the one-line route that renders an editable native slide for you.
Free skills and prompts for Claude and strategy work
Templates for Claude, ChatGPT and Perplexity — from diagnostics to board-ready decks.
How to build a cost synergy bridge slide in PowerPoint
To build a cost synergy bridge slide in PowerPoint, set a Baseline cost bar on the left and a Target cost bar on the right, then place a floating decrement bar for each MECE synergy bucket between them, in descending size: Headcount, Procurement, Footprint, Overhead. Add one upward increment bar for dis-synergies and one-off costs, connect every step with thin leader lines, and label the net. Modern PowerPoint has a native Waterfall chart type, and Oria can render the whole bridge as an editable native slide from one line of text.
This guide walks the structure, gives you the exact prompts to bucket the savings and sequence the bridge, and shows the faster one-prompt route. Everything you need is here. You will not have to leave to get the substance.
What a synergy bridge is and when to use it
A synergy bridge is a waterfall slide that walks from a baseline cost to a target cost through a sequence of labeled savings. The baseline anchors the left, each synergy bucket pulls the running total down as a floating decrement bar, dis-synergies push it back up, and the target lands on the right. It is a cost variant of the classic bridge chart, built around savings levers rather than revenue movements.
Reach for it in M&A integration and cost programs, when the message is how you get from today's cost base to the committed target and which levers carry the load. Steering committees and integration management offices expect the bridge because it makes the plan defensible in one slide: the size of each bar shows where the value sits, and the add-back keeps the net honest. If your story is a revenue movement rather than a cost reduction, the more general waterfall chart slide is the better starting point; the synergy bridge is the cost-program version of it.
The anatomy of a cost synergy bridge slide
Six parts carry the whole slide. Get these right and the bridge reads itself.
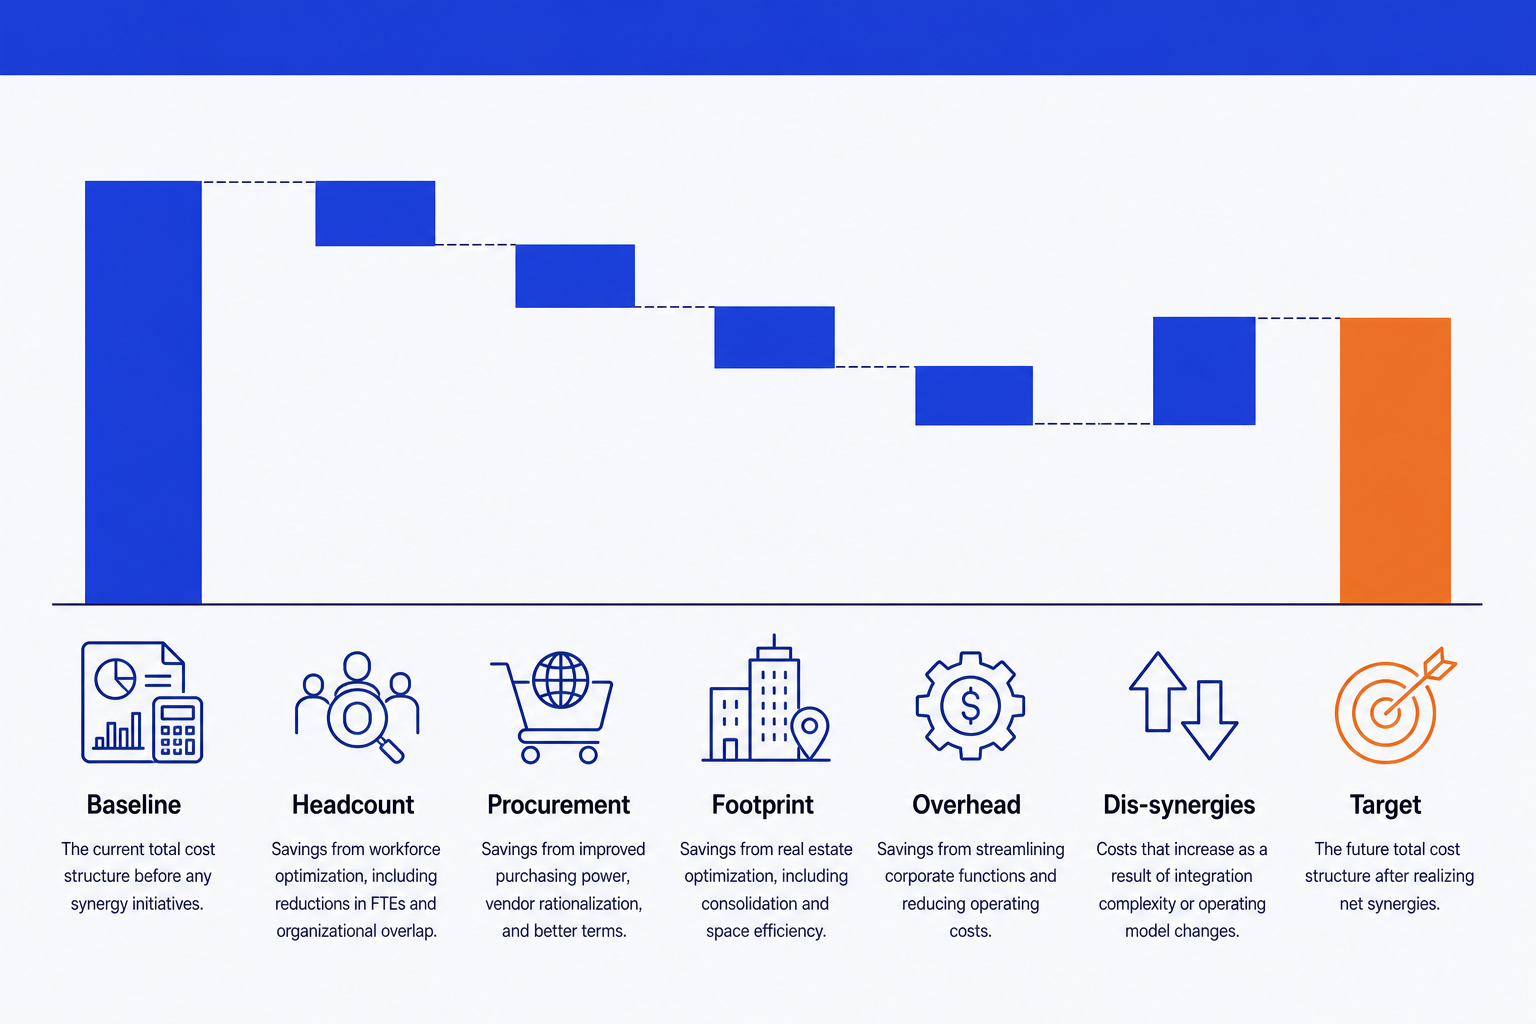
Baseline bar. The current cost base the story begins from, anchored to the axis so the audience knows where the bridge starts.
Synergy buckets. One floating decrement bar per MECE lever, ordered largest to smallest, in one consistent color so the savings read as a group.
Dis-synergies. An upward increment bar for the costs the deal adds back, in a second color so the net is never overstated.
Target bar. The committed end-state cost the audience cares about. Give it the emphasis color so the slide lands on the answer.
Leader lines. Thin connectors linking the top of each step to the base of the next, so the bridge reads in order without gaps.
Net label. A clear callout of the total saving from baseline to target, so the so-what is impossible to miss.
Build the bridge step by step, with the real gotchas
The classic method uses a stacked bar chart and an invisible base series to make the middle bars float. Modern PowerPoint has a native Waterfall type under Insert, Chart, Waterfall, which is quicker for a rough internal view. Use the manual method when you need full control over the bucket order, the add-back, and color emphasis.
Set the Baseline bar on the left and the Target bar on the right. Anchor both to the axis as totals, not floating bars. They frame the bridge and fix the scale before anything moves.
Add a decremental floating bar for each synergy bucket. Place one downward bar per MECE lever between baseline and target, ordered largest first: Headcount, Procurement, Footprint, Overhead. Each sits on the running total left by the bar before it.
Add an increment bar for dis-synergies and one-off costs. After the savings, place one upward bar for retention, severance, integration spend, or revenue leakage, so the path to target is honest.
Make the base series invisible. Click the base series, set its fill to No Fill and its border to None, so the savings and add-back float at the right height. This is the whole trick of a manual bridge.
Connect the steps with leader lines. Draw thin lines from the top of each bar to the base of the next, or turn on the chart's connector option. They are what make it a bridge rather than a row of floating blocks.
Label the net and write the action title. Call out the total saving from baseline to target, then replace the topic label with a full-sentence so-what that names the largest lever. The title is the slide; the bridge is the proof.
Align and format. Hold the savings to one color, the add-back to a second, and the target to the emphasis color. Even spacing, one decimal place, and a clean axis are what make it board-ready.
Gotcha
The Target bar must start from the baseline, not float on the invisible base. Set its base value to zero so it grows from the axis, then color it as the emphasis total. In the native Waterfall chart, right-click the point and choose Set as Total.
The one-prompt route: describe the bridge, get an editable slide
The invisible base series, the bucket ordering, and the hand-drawn leader lines are exactly the kind of mechanical work that eats an evening before a steering committee. Oria removes it. It is an AI add-in that runs in the PowerPoint task pane and produces fully editable native PowerPoint elements, in your corporate template. You describe the bridge in one line and Oria renders the cost synergy bridge slide for you.
Because the output is native, every bar, label, and leader line stays editable afterward. You can reorder a bucket, rename a lever, or adjust the add-back without rebuilding anything. The same approach works for any dense slide, from a bridge to a market sizing funnel, which is why Oria suits the integration decks consultants and bankers actually ship.
One-line synergy bridge prompt for Oria
The prompts that build the cost synergy bridge slide
These are the exact copy-paste prompts we use to bucket the savings, sequence the bridge, and turn an integration plan into the slide. The first three are for Oria inside PowerPoint; the last two are for shaping the data in Claude before you build. Replace the bracketed parts with your own program.
Shape the data in Claude first
Group a savings list into MECE synergy buckets
Sequence the bridge from baseline to target
Build the slide in Oria
Turn an integration plan into the bridge
Set the color emphasis
Write the action title on the slide
Tip
Bucket and sequence the savings in Claude, then hand the clean baseline, buckets, add-back, and target straight to Oria. For the wider lever library behind a cost program, see the Claude skills for cost cutting.
Common mistakes to avoid
For another dense finance slide built the same way, from one clean set of inputs to an editable native layout, see how to build a market sizing slide.
Frequently asked questions
What is a cost synergy bridge slide?
It is a waterfall slide that walks the audience from a baseline cost to a target cost through a sequence of labeled savings. The baseline bar sits on the left, each synergy bucket pulls the running total down as a floating decrement bar, any dis-synergy or one-off cost pushes it back up, and the target bar lands on the right. The story is the path from one number to the other, bucket by bucket.
When should I use a synergy bridge instead of a plain savings table?
Use the bridge when the message is how you get from today's cost to the target, and which levers carry the load. A table lists the numbers; the bridge shows the sequence and the relative size of each lever at a glance. In M&A integration and cost programs, partners and steering committees expect the bridge because it makes the plan defensible in one slide.
How do I group savings into MECE synergy buckets?
Sort every initiative into a small set of mutually exclusive, collectively exhaustive buckets so nothing is double counted and nothing is missed. Common cost buckets are Headcount, Procurement, Footprint, and Overhead. Keep four to six buckets so the bridge stays legible, and hold each initiative to exactly one bucket.
What are dis-synergies on a synergy bridge?
Dis-synergies are the costs the deal or program adds back: retention bonuses, severance, integration spend, system migration, or revenue leakage. On the bridge they appear as an upward increment bar between the savings and the target, so the net number is honest. Leaving them off is the fastest way to lose credibility with a steering committee.
What is the fastest way to build a cost synergy bridge slide?
Describe the bridge in one line and let Oria render it. You give the baseline, each labeled synergy bucket as a decrement, the dis-synergy add-back, and the target, and Oria builds a fully editable native PowerPoint bridge in your template, including the connectors and the color emphasis. You skip the invisible base series and the manual leader lines entirely.