
How to Build a Target Operating Model Slide in PowerPoint
The five stacked layers, the step-by-step manual build with the real gotchas, the prompts that make it sharp, and the one-line route that renders an editable native layout for you.
Free skills and prompts for Claude and strategy work
Templates for Claude, ChatGPT and Perplexity — from diagnostics to board-ready decks.
How to build a target operating model slide in PowerPoint
To build a target operating model slide in PowerPoint, stack five horizontal layers from the top down: Strategy and ambition, Core processes, Organization and governance, People and capabilities, and Technology and data. Give each layer a short descriptor and a small icon, emphasize the strategy layer at the top, and write an action title that states the future-state design in one line. Oria can render the whole slide as editable native shapes from one line of text.
This guide walks the manual build and its real gotchas, gives you the exact prompts to draft the five layers and the title, and shows the faster one-prompt route. Everything you need is here. You will not have to leave to get the substance.
What the target operating model is and when to use it
A target operating model, often shortened to TOM, is a one-page picture of how an organization will run in its future state. It sets the design across the layers that make a business work: the strategy and ambition at the top, the core processes that deliver value, the organization and governance that decides, the people and capabilities that execute, and the technology and data that enable everything beneath. Read top to bottom, the strategy should flow down so every layer supports the one above it.
Reach for it whenever you need to align stakeholders on the whole future-state design before the detailed work starts. Framing a transformation. Scoping a post-merger integration. Setting the case for a new operating structure. It is a layered design, not a process flow, so use a sequence layout like a strategy roadmap slide when you are showing phases over time, and the target operating model when you are mapping how the organization is built.
The five layers of the target operating model slide
Five stacked layers carry the whole model. Get the fit between them right and the slide shows how the future organization will run on its own.
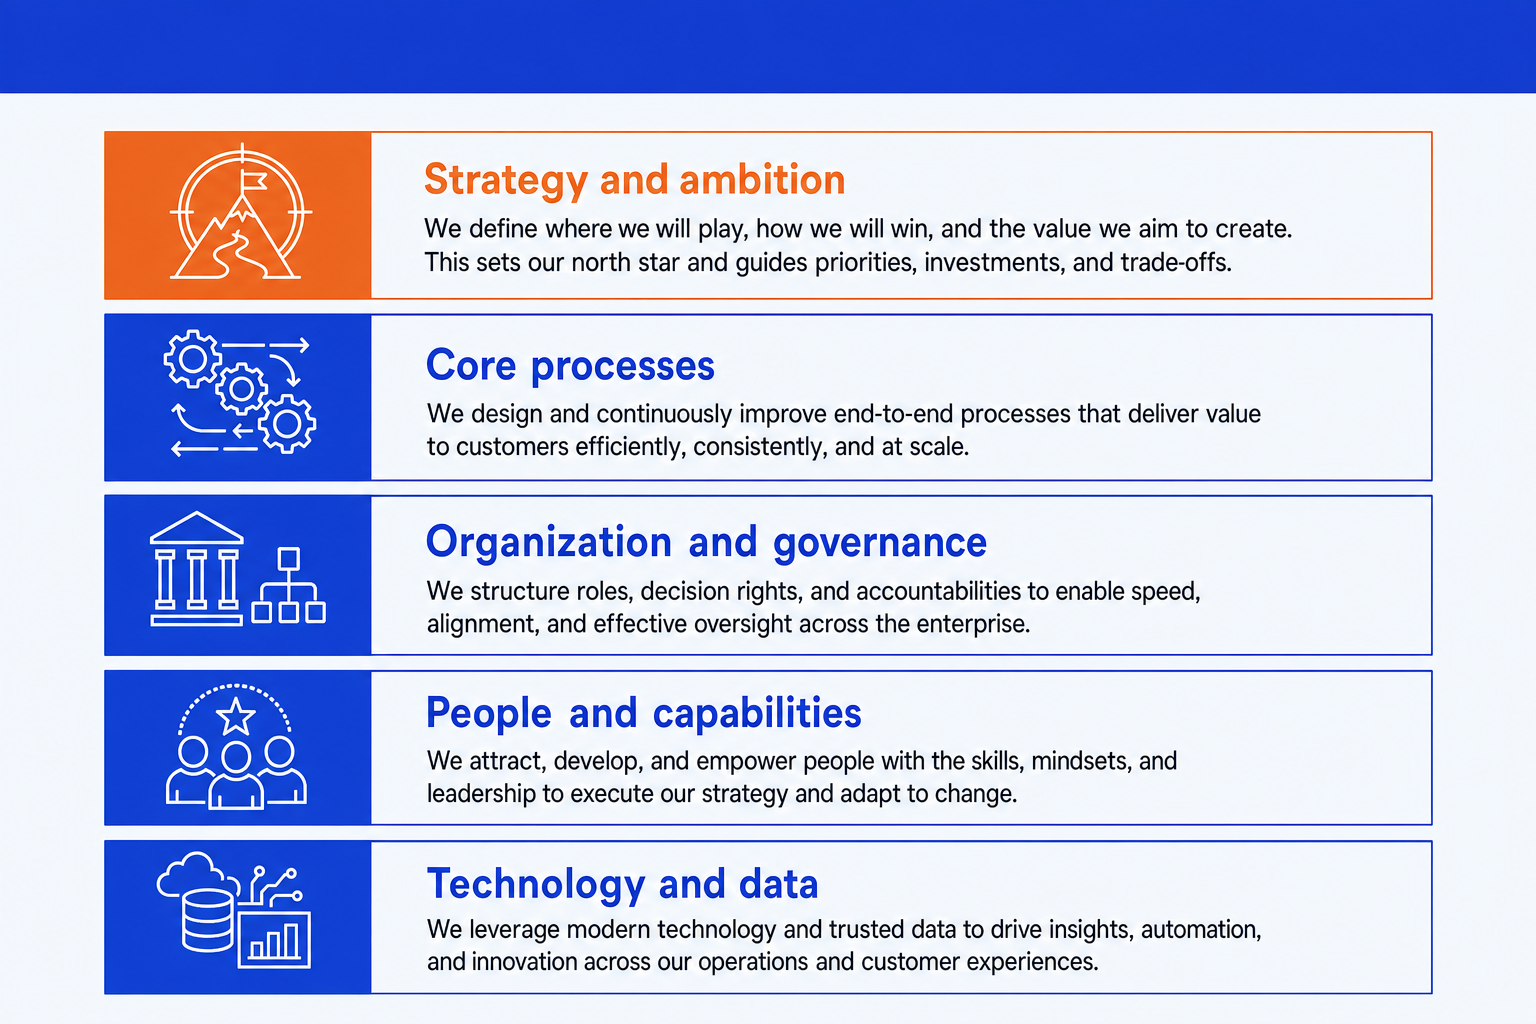
Strategy and ambition. The top layer. The direction, goals, and value the model exists to deliver, stated clearly enough that every layer below can be traced back to it.
Core processes. The handful of end-to-end processes the organization must run well to deliver its value, from the customer-facing to the supporting.
Organization and governance. The structure, decision rights, and accountability that determine who owns what and how decisions get made.
People and capabilities. The roles, skills, and ways of working the model requires, including the capabilities that need to be built or hired.
Technology and data. The enabling foundation: the systems, platforms, and data that the processes and people depend on to operate.
The step-by-step manual build, with the real gotchas
PowerPoint has no native operating model layout, so the manual method builds the five layers from a column of stacked bands. The trick is the rhythm: equal-height bands, a consistent label position, and one accent on the strategy layer. Build it once as a reusable layout and you can refill it for any transformation.
Stack the five bands. Draw five equal-height rectangles in a single column: Strategy and ambition at the top, then Core processes, Organization and governance, People and capabilities, and Technology and data at the base. Keep the bands the same width so the stack reads as one frame.
Label every layer consistently. Put the layer name on the left of each band and leave room on the right for a one-line descriptor. Use one header style across all five so the slide reads as a single model, not five separate boxes.
Add a one-line descriptor per layer. Write a short phrase to the right of each label that says what the layer covers in this specific organization, never a generic definition. The descriptor is where the slide earns its keep.
Add a small icon per layer. Place one clean icon at the left edge of each band: a target for strategy, a flow for processes, an org for governance, a person for people, a database for technology. Keep them the same size and color.
Emphasize the strategy layer. Give the top band the accent color or a slightly heavier border so the eye starts at the ambition, then reads down through the layers that deliver it.
Write the action title. Replace the topic label with a full-sentence so-what that states the future-state design, like how the organization will be structured to deliver its ambition. The title frames the slide; the layers are the proof.
Gotcha
The layers must connect, not just sit on top of each other. Every core process should have an owner in the governance layer, a capability in the people layer, and a system in the technology layer. A model where the bottom layers do not support the processes above them is a list of buzzwords, not an operating model.
The one-prompt route: describe the model, get an editable slide
Drawing and aligning five stacked bands with matching icons by hand is exactly the kind of mechanical work that eats an evening. Oria removes it. It is an AI add-in that runs in the PowerPoint task pane and produces fully editable native PowerPoint elements in your corporate template. You describe the five layers in one line and Oria renders the target operating model slide for you.
Because the output is native shapes and text, every layer stays editable afterward. You can rename a process, recolor the strategy band, or move a descriptor without rebuilding the stack. The same approach works for any complex framework slide, which is why Oria suits the dense decks consultants and strategy teams actually ship. See how to build a value chain analysis slide for a related operating view of the business.
One-line target operating model prompt for Oria
The prompts that make the target operating model slide sharp
These are the exact copy-paste prompts we use to lay out the stack, fill the five layers, and write the title. The first three are for Oria inside PowerPoint; the last two are for drafting the model in Claude before you build. Replace the bracketed parts with your own organization.
Build the slide in Oria
Lay out the five-layer stack
Fill the layers from notes
Emphasize the top layer and write the title
Draft the model in Claude first
Draft the five layers from a description
Pressure-test the model for coherence
Tip
Draft and pressure-test the model in Claude, then hand the clean five layers straight to Oria to render. For a related framework built the same disciplined way, see how to build a Business Model Canvas slide.
Common mistakes to avoid
For the time-phased view of how the model gets delivered, see how to build a strategy roadmap slide, which walks the phases from current state to target.
Frequently asked questions
What is a target operating model slide used for?
A target operating model slide shows how an organization will run in the future, on one page, across the layers that make it work: strategy and ambition, core processes, organization and governance, people and capabilities, and technology and data. Transformation leads, strategy teams, and operating partners use it to align stakeholders on the future-state design before the detailed work begins. The point is the coherence between the layers, not any single box.
What are the layers of a target operating model?
Most target operating models stack five layers from the top down: Strategy and ambition at the top sets the direction, Core processes describe what the organization does to deliver value, Organization and governance defines who decides and how, People and capabilities cover the skills and roles required, and Technology and data are the enabling foundation. Each layer must support the one above it, so the strategy at the top should be traceable all the way down to the data and systems at the base.
Does PowerPoint have a built-in target operating model template?
PowerPoint does not ship a native target operating model layout, so most people build the stacked layers by hand from a column of bands or download a third-party template. The manual build in this guide gives you full control over the proportions and the labels. Oria can render the whole target operating model slide as editable native shapes from one line of text, in your corporate template.
How is a target operating model different from an org chart?
An org chart shows reporting lines and who sits where. A target operating model is broader. It shows how the whole organization is designed to deliver its strategy across processes, governance, people, and technology, with the org structure being only one layer of it. Use an org chart to show hierarchy, and a target operating model slide to show the end-to-end design of how the business will run.
What is the fastest way to build a target operating model slide?
Describe the five layers in one line and let Oria render the slide. You give the ambition, the core processes, the organization and governance, the people and capabilities, and the technology and data, and Oria builds a fully editable native PowerPoint layout in your template, with the top layer emphasized. You skip drawing and aligning the stacked bands by hand entirely.