
How to Build a TAM SAM SOM Slide: 3 Layout Options
Three layouts to choose from, the exact PowerPoint build steps for each, the prompts that make Oria render it for you, and the mistakes that make a TAM SAM SOM slide look amateurish.
Free skills and prompts for Claude and strategy work
Templates for Claude, ChatGPT and Perplexity — from diagnostics to board-ready decks.
How to build a TAM SAM SOM slide
To build a TAM SAM SOM slide, pick one layout, concentric circles, a narrowing funnel, or stacked bars, then draw the shapes to true proportion, align them precisely, and label each figure with its value and a one-line assumption. Emphasize the obtainable SOM figure in your accent color and finish with an action title.
This guide walks all three layouts, the exact build steps for each, the prompts that make Oria render one for you, and the mistakes that make a TAM SAM SOM slide look amateurish. Everything you need is here.
What a TAM SAM SOM slide shows
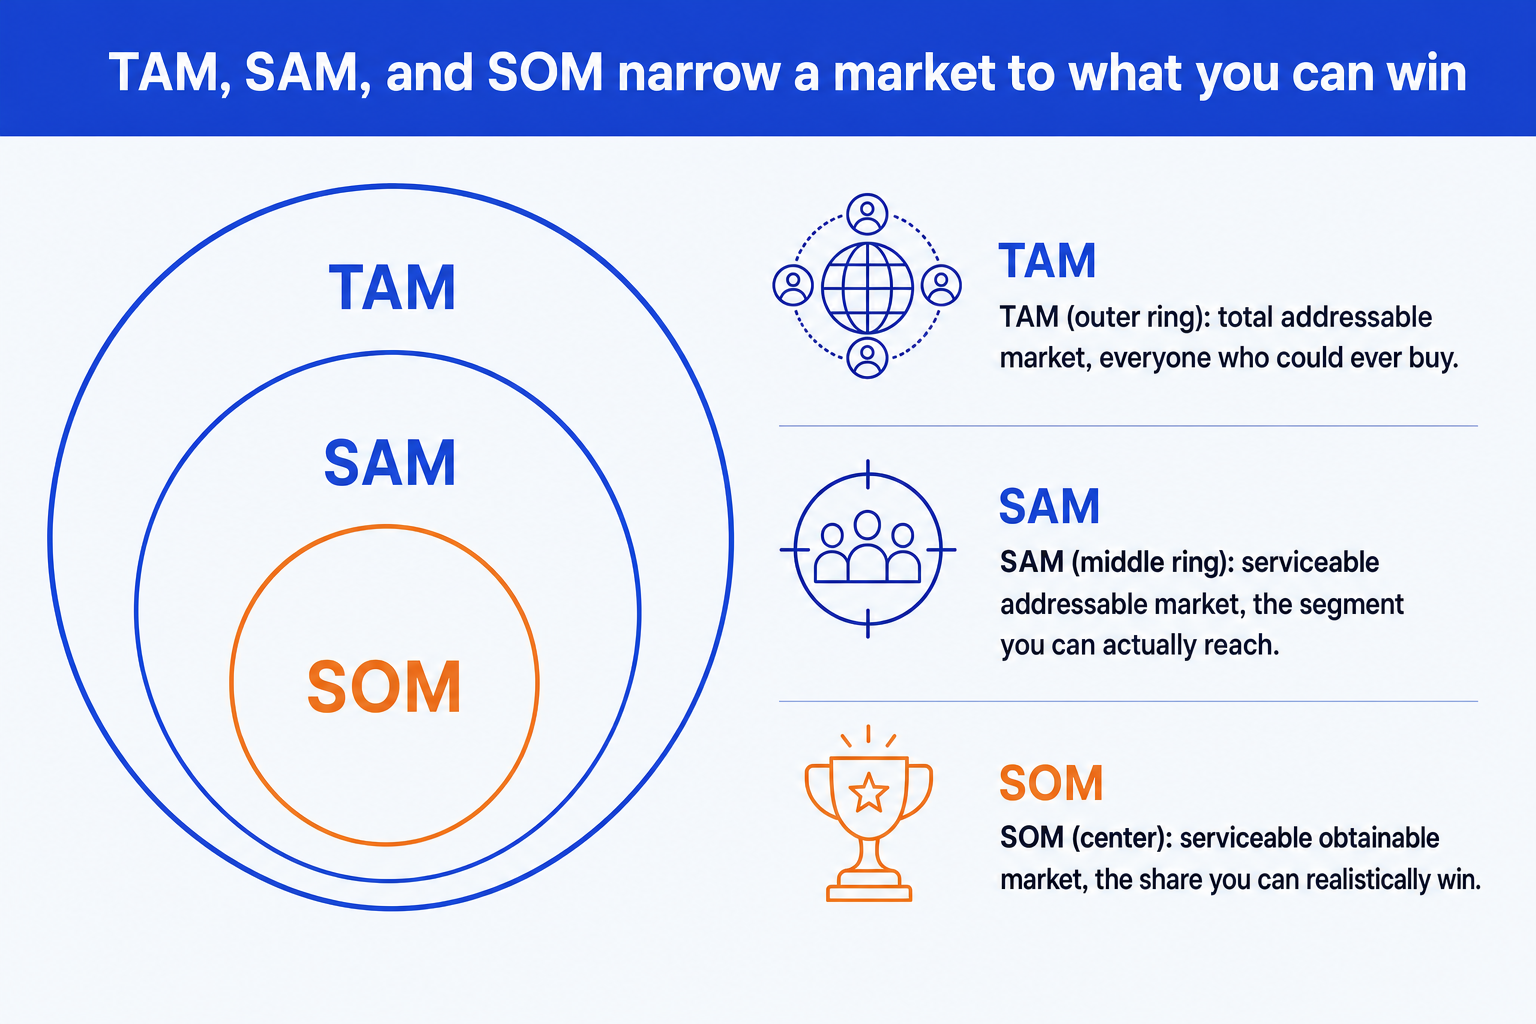
A TAM SAM SOM slide narrows a market opportunity from the broadest possible demand down to the share you can realistically win. TAM is the total addressable market, SAM is the slice you can actually reach, and SOM is the share you can obtain given competition and capacity. The slide's job is to make that narrowing visible at a glance through a layout that gets smaller from TAM to SOM.
This page focuses on the build, which layout to pick and how to construct it cleanly. For the sizing math itself, top-down versus bottom-up estimation and how to triangulate the two, see our full guide on how to build a market sizing slide.
3 ways to lay out a TAM SAM SOM slide
There is no single correct layout. The right one depends on what your slide needs to argue, one clean visual, a story about specific filters, or a dense exhibit sitting next to other charts.
Concentric circles
Best for
Three cleanly nested figures with a single visual center of gravity. The most common choice for a market sizing exhibit.
Watch out for
The SOM circle can get too small to hold its label. Set a minimum readable diameter and move the label outside with a leader line if needed.
Narrowing funnel
Best for
Showing the filters that narrow TAM to SOM as distinct stages, useful when you want to name the segment, geography, or competitive filter at each step.
Watch out for
More than four bands crowd the shape and bury the story. Cap it at three or four stages.
Stacked horizontal bars
Best for
Dense decks where the reader needs the exact figures at a glance, next to other charts on the same slide.
Watch out for
Bars drawn to equal length instead of true proportion flatten the gap between TAM and SOM. Scale bar length to the value.
The concentric circle version above is the default choice for most decks. Reach for a funnel when the story is about the filters, and stacked bars when the slide needs to sit beside other charts and carry exact numbers.
Step-by-step: build the slide in PowerPoint
Once you have picked a layout, the build is a geometry problem. These steps work for any of the three, with the shape swapped for circles, trapezoids, or bars.
Pick the layout that matches your story from the three options above, then set up three shapes: circles for concentric, trapezoids for a funnel, or rectangles for stacked bars.
Scale each shape to true proportion. For circles, scale the radius to the square root of the value, not the value itself, so area rather than radius represents the number. A circle sized directly to the value looks far more dramatic than the real gap.
Align the shapes precisely. For concentric circles, use align center and align middle on all three at once rather than eyeballing it. For a funnel or stacked bars, align left edges and keep spacing even.
Set the color hierarchy. Keep TAM and SAM in muted tones of your brand's primary color and reserve the accent color for SOM alone, so the eye lands on the obtainable share first.
Place labels where they stay readable. If a figure's shape is too small to hold its label, move the label just outside with a short leader line instead of shrinking the text below a legible size.
Add a one-line assumption beside each figure naming the source or filter, then replace the topic label with an action title stating the so-what.
Where the TAM, SAM, and SOM numbers come from
A clean layout only helps if the underlying figures are defensible. Size each one top-down from a published market figure and bottom-up from unit economics, then check that the two methods land close together before you trust the number. For the full walk-through, including the exact prompts to size and triangulate a market, see how to build a market sizing slide with TAM SAM SOM.
The one-prompt route: build the TAM SAM SOM slide with Oria
Scaling shapes to true proportion, centering three circles exactly, and balancing label placement is exactly the kind of mechanical work that eats an evening. Oria removes it. It is an AI add-in that runs in the PowerPoint task pane and produces fully editable native PowerPoint elements, in your corporate template. Describe the layout and the three figures in one line, and Oria renders the slide for you.
Because the output is native PowerPoint, every circle, band, label, and note stays editable afterward. You can swap a figure, rename a segment, or recolor the emphasis without rebuilding anything. See the Claude skills for slide design for the storyline side of the workflow.
One-line prompt for the concentric circle layout
The exact prompts for each TAM SAM SOM layout
These are the copy-paste prompts we use to build each of the three layouts in Oria, plus one to check your proportions before you present. Replace the bracketed parts with your own figures.
Build it in Oria
Concentric circles
Narrowing funnel
Stacked horizontal bars
Check it before you present
Check the proportion is honest
Tip
Size and triangulate the market first, then hand the clean figures straight to Oria for the layout. For a numeric bridge instead of a nested diagram, see how to build a waterfall chart slide.
Common TAM SAM SOM slide mistakes
For the wider habits that make AI-built slides look board-ready rather than generic, the consultant's guide to Claude covers the end-to-end method from analysis to deck.
Frequently asked questions
How do you build a TAM SAM SOM slide?
Pick one of three layouts, concentric circles, a narrowing funnel, or stacked bars, then draw the shapes to true proportion, center or align them precisely, label each figure with its value, add a one-line assumption beside each, and emphasize the obtainable SOM figure in your accent color. Finish with an action title that states the so-what rather than a topic label.
What is the best layout for a TAM SAM SOM slide?
Concentric circles work best when you want a single clean visual with three nested figures. A funnel suits a story about the specific filters that narrow the market, such as segment or geography. Stacked bars fit dense decks where the reader needs to compare the exact numbers against other charts on the same page.
Should the circles be sized to scale?
Yes, but scale the radius to the square root of the value, not the value itself. Area, not radius, is what a reader perceives as the size of each ring. Scaling diameter directly to the value makes the difference between TAM and SOM look far larger than it really is.
How many stages should a TAM SAM SOM funnel have?
Three is the core structure: TAM, SAM, SOM. You can add one extra band if you need to call out a specific filter, such as a geography cut, but cap it at four. More stages crowd the shape and the narrowing story gets lost.
What is the fastest way to build a TAM SAM SOM slide?
Describe the layout and the three figures in one line and let Oria render it. You get a fully editable native PowerPoint slide in your template, with the shapes sized, centered, and labeled, so you skip the manual alignment work entirely.