
How to Build a Go-to-Market Funnel Slide in PowerPoint
What the funnel stages show, how to set conversion rates and the metric per stage, the step-by-step manual build with the real gotchas, the prompts that sharpen it, and the one-line route that renders an editable native slide for you.
Free skills and prompts for Claude and strategy work
Templates for Claude, ChatGPT and Perplexity — from diagnostics to board-ready decks.

How to build a go-to-market funnel slide
To build a go-to-market funnel slide, lay out four to six stages that descend from market awareness to closed customers, with each stage narrower than the one above it. Put a conversion rate on the boundary between every pair of stages, and tie one clear metric to each stage. Highlight the weakest conversion in the emphasis color, because the biggest drop-off is usually the point of the slide. Write an action title that states the so-what, then keep the funnel clean and descending. Oria can render the whole layout as an editable native slide from one line of text.
This guide walks the manual build and its real gotchas, gives you the exact prompts to set the stages and conversion rates, and shows the faster one-prompt route. Everything you need is here. You will not have to leave to get the substance.
What a go-to-market funnel slide is and when to use it
A go-to-market funnel slide shows how prospects move from broad market reach down to revenue, one stage at a time. It answers two questions at once: how much volume enters at the top, and how efficiently that volume converts at each step. The point of the slide is the narrowing and the drop-off between stages, not just the final customer count, so the conversion rates have to be visible.
Reach for it in go-to-market plans, board updates, sales reviews, investment memos, and fundraising decks, anywhere the audience needs to see the shape of the pipeline and where it leaks. It is a staple of strategy and finance work because it turns a scattered set of pipeline numbers into one legible story. For the demand-side view of who moves through it, a customer journey map slide is the better fit; use the funnel when the message is conversion and volume.
Choosing the funnel stages
A common B2B sequence runs from awareness to closed customers, with each stage narrower than the last. Map the funnel to the pipeline your team actually tracks, and keep it to four to six stages so the drop-off points stay legible.
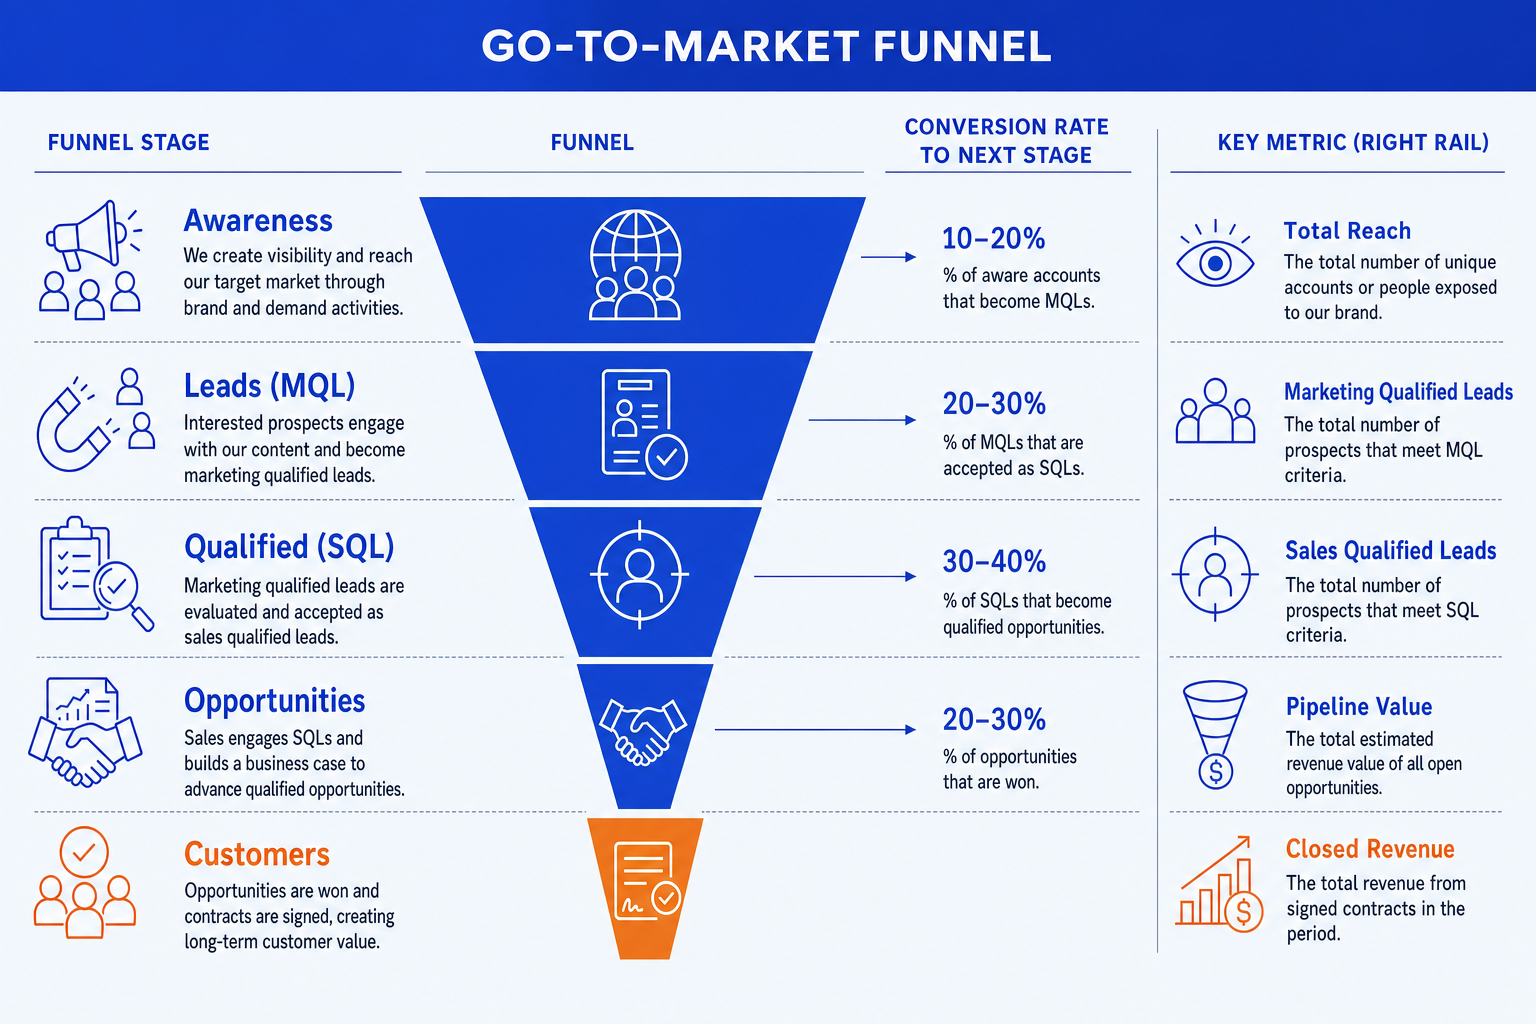
Awareness. The top of the funnel: everyone reached by your marketing and demand generation. Measure it in impressions or reach, the broadest band of the slide and the universe the rest narrows from.
Leads (MQL). Prospects who showed enough interest to become marketing qualified leads. Measure lead volume here. This is the first real hand-raise and the start of the sales conversation.
Qualified (SQL). Leads that sales has vetted as a genuine fit, the sales qualified leads. Measure the qualified count. The conversion from MQL to SQL is where loose interest gets filtered into real demand.
Opportunities. Qualified prospects with an active deal in the pipeline. Measure pipeline value, not just count, because this is where forecasting starts and where deal size begins to matter.
Customers. Closed-won deals: the revenue at the bottom of the funnel. Measure bookings or won revenue. Give this stage the emphasis color, because it is the outcome the whole slide builds toward.
Conversion rates and the metric per stage
Two numbers carry the funnel: the conversion rate between each pair of stages, and the single metric inside each stage. Get both consistent and the slide reads itself.
Conversion rates
Place the rate on the boundary between two stages, not inside one, so it reads as the share that advanced. Use the same basis throughout, stage to stage rather than stage to top, so the rates are directly comparable down the funnel.
One metric per stage
Give each stage one metric its owning team is accountable for: reach, lead volume, qualified count, pipeline value, won revenue. Keep the unit consistent within a column and never mix counts and currency in the same place.
The weakest link
Find the lowest conversion rate and highlight it in the emphasis color. The biggest drop-off is almost always the point of the slide, the place where money leaks and where the next initiative should aim. Make the eye land there.
The step-by-step manual build, with the real gotchas
The classic layout is a descending funnel of stacked bands that taper from top to bottom, with conversion labels between them and a metric rail on the right. Build it from native shapes so every element stays editable.
List the stages first. Write the four to six stages your team tracks, top to bottom, awareness to customers. A funnel built on stages nobody manages tells a story nobody can act on.
Draw the descending bands. Create stacked trapezoid or rectangle bands that narrow toward the bottom so the eye reads the narrowing in one glance. Keep the vertical spacing even and the bands center-aligned.
Add the metric inside each band. Put one number per stage, in a consistent unit within the column, so the audience never has to convert in their head. Counts at the top, currency at the bottom.
Set the conversion rates between bands. Place each rate on the boundary between two stages, computed stage to stage on the same basis, so the percentages are comparable all the way down.
Emphasize the weakest conversion. Recolor the lowest rate and its boundary in the emphasis orange so the biggest drop-off is the first thing the audience sees.
Write the action title. Replace the topic label with a full-sentence so-what, naming the leaking stage and the size of the prize from fixing it. The title is the slide; the funnel is the proof.
Gotcha
Keep every conversion rate on the same basis. Mixing stage-to-stage rates with stage-to-top rates in the same funnel makes the percentages look wrong and invites a question you cannot answer cleanly. Pick one basis, label it once, and apply it to every boundary on the slide.
The one-prompt route: describe the funnel, get an editable slide
Tapering five bands evenly, aligning the conversion labels on each boundary, and keeping the metric rail tidy is exactly the kind of mechanical work that eats an evening. Oria removes it. It is an AI add-in that runs in the PowerPoint task pane and produces fully editable native PowerPoint elements, including the funnel shapes, the conversion labels, and the metric rail, in your corporate template. You describe the funnel in one line and Oria renders the go-to-market funnel slide for you.
Because the output is native PowerPoint, every band, rate, and metric stays editable afterward. You can swap a figure, rename a stage, or recolor the emphasis without rebuilding anything. The same approach works for any complex slide, from a funnel to a dashboard, which is why Oria suits the dense decks consultants and bankers actually ship. To turn the bottom-of-funnel numbers into a tracked view, see how to build a KPI dashboard slide.
One-line go-to-market funnel prompt for Oria
The prompts that make the funnel slide defensible
These are the exact copy-paste prompts we use to lay out the funnel, set the conversion rates, and write the title. The first three are for Oria inside PowerPoint; the last two are for reasoning about the funnel in Claude before you build. Replace the bracketed parts with your own figures.
Build the slide in Oria
Spec the funnel layout
Add the conversion rates and the metric rail
Choose the emphasis and write the title
Reason about the funnel in Claude first
Pick the stages and compute conversions
Sharpen the action title
Tip
Reason about the stages and conversion math in Claude, then hand the clean stage names, rates, and metrics straight to Oria. To frame the size of the prize at the top of the funnel, pair this with how to build a market sizing slide.
Common mistakes to avoid
For the wider habits that make AI-built slides look board-ready rather than generic, the consultant's guide to Claude covers the end-to-end method from analysis to deck.
Frequently asked questions
What is a go-to-market funnel slide?
A go-to-market funnel slide shows how prospects move from broad market awareness down to closed customers, stage by stage. Each stage is narrower than the one above it, and a conversion rate sits between every pair of stages. The slide makes the shape of the pipeline visible, exposes where prospects drop off, and ties one clear metric to each stage so the audience can see both the volume and the efficiency of the funnel in a single glance.
What stages belong on a go-to-market funnel?
A common B2B sequence runs awareness, leads or marketing qualified leads, sales qualified leads, opportunities, and closed customers. The right stages are the ones your team actually tracks and acts on, so map the funnel to your real pipeline rather than a generic template. Four to six stages is the sweet spot. Fewer hides the drop-off points; more clutters the slide and dilutes the story.
How do I show conversion rates between funnel stages?
Place the conversion rate on the boundary between two stages, not inside a stage, so it clearly reads as the percentage of prospects that advanced. Use the same basis throughout, stage to stage rather than stage to top, so the rates are comparable. Highlight the weakest conversion in the emphasis color, because the lowest rate is usually the most important point on the slide and the place the audience should focus.
What metric should each funnel stage carry?
Give each stage one metric that the owning team is accountable for: impressions or reach at awareness, lead volume at the top of sales, qualified counts in the middle, pipeline value at opportunities, and bookings or won revenue at the bottom. Keep the unit consistent within a column and avoid mixing counts and currency in the same place. One metric per stage keeps the slide legible and the conversation focused.
What is the fastest way to build a go-to-market funnel slide?
Describe the funnel in one line and let Oria render it. You give the stage names, the conversion rate between each pair, and the metric per stage, and Oria builds a fully editable native PowerPoint slide in your template, including the descending funnel shapes, the conversion labels, and the metric rail. You skip the manual shape tapering and connector alignment entirely.