
How to Build a Pricing Waterfall Slide in PowerPoint
The list-to-pocket price bridge that shows where margin leaks away, the step-by-step manual build, the exact prompts that make it sharp, and the one-line route that renders an editable native bridge for you.
Free skills and prompts for Claude and strategy work
Templates for Claude, ChatGPT and Perplexity — from diagnostics to board-ready decks.

How to build a pricing waterfall slide in PowerPoint
To build a pricing waterfall slide in PowerPoint, lay out a descending bridge from list price to pocket price. Start with a full-height list price bar, then add one downward step for each form of leakage, invoice discounts, off-invoice rebates, payment-term costs, and promotions, and finish on the pocket price bar. Use a stacked bar chart with an invisible base series so each deduction floats at the right height, add connector lines, and emphasize the pocket price. Oria can render the whole bridge as an editable native slide from one line of text.
Note the distinction up front. This is the price waterfall, the leakage bridge from list to pocket, not a generic financial waterfall that bridges any two totals. For the general version, see how to build a waterfall chart slide. This guide walks the manual build, gives you the exact prompts, and shows the faster one-prompt route. Everything you need is here.
What a pricing waterfall is and when to use it
A pricing waterfall, often called the pocket price waterfall, shows how the price you quote becomes the price you keep. It starts at list price on the left, walks down through each deduction, and lands on pocket price on the right. The descending bars in the middle are the leakage; the gap between the first bar and the last is the margin that never reaches the bottom line.
Reach for it whenever the message is about price realization. Commercial diligence on a target's true margins. A pricing review that asks where discounts pile up. A board read on why net revenue trails the rate card. Unlike a generic bridge, this one is almost always one-directional: every step takes you down, and the labels are fixed pricing concepts rather than arbitrary line items. That is what makes it a pattern worth building once and reusing.
The leakage steps in a pricing waterfall slide
Five elements carry the slide: the list price you start from, three or four leakage steps in between, and the pocket price you land on. Get the steps in the right order and the bridge reads itself.
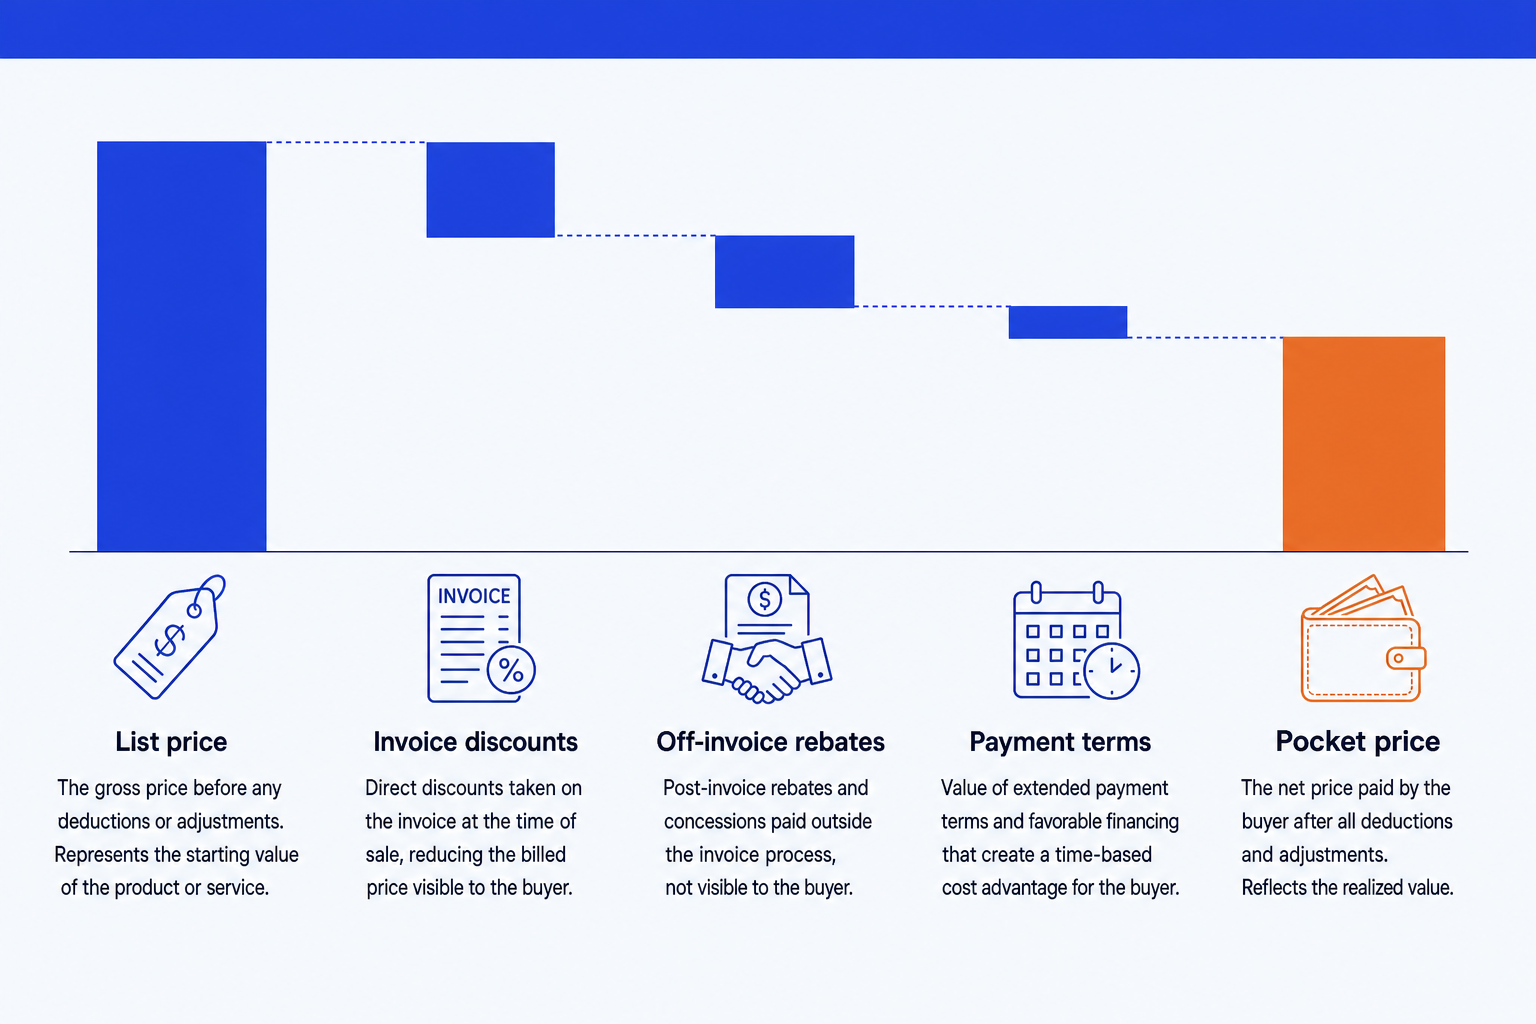
List price. The published rate card or quoted price, the full-height bar the bridge starts from. It is the number the customer sees before any negotiation.
Invoice discounts. Volume, customer, and order-size discounts that appear on the invoice itself. They take list price down to invoice price, the first visible cut.
Off-invoice rebates. Annual, growth, and loyalty rebates paid after the sale, so they never show on the invoice. They are the easiest leakage to underestimate.
Payment terms. The carrying cost of generous terms like net-60 or net-90, the value of money the customer holds before paying. Small per deal, large in aggregate.
Pocket price. What lands in your pocket after every deduction, the bar the audience actually cares about. Give it the emphasis color so the slide ends on the answer.
Promotions and co-op marketing allowances often sit as a sixth step between payment terms and pocket price. Add them when they are material, fold them into off-invoice when they are small, and never let the bridge sprawl past six steps.
The step-by-step manual build, with the real gotchas
The classic method uses a stacked bar chart and an invisible base series so each deduction floats at the right height. Modern PowerPoint also has a native Waterfall type under Insert, Chart, Waterfall, which is quicker for a rough internal view. Use the manual method when you need full control over the descending bridge, the subtotal bars, and the pocket-price emphasis.
Lay out the data with a base column. Put the bar labels in column A, the step values in column B as negative numbers for each leakage, and a column C base that holds the running total each floating bar sits on. List price and pocket price use a base of zero.
Insert a stacked bar (column) chart. Select the base column and the value column together and insert a stacked column chart so each category shows the base stacked under the visible deduction.
Make the base series invisible. Click the base series, set fill to No Fill and border to None. The deduction bars now hang from the running total, which is the trick that turns a stacked chart into a descending bridge.
Anchor list price and pocket price as totals. Set their base to zero so they grow from the axis as full-height bars, then color them as totals rather than leakage steps. In the native Waterfall chart, right-click each and choose Set as Total.
Color leakage and emphasize pocket price. Give every deduction one muted color so the eye groups them as leakage, and give the pocket price bar the emphasis color so the slide lands on what you keep.
Add connectors and the action title. Draw thin lines from the top of each bar to the base of the next so the bridge reads in order, then replace the topic label with a so-what title, the pocket price and the biggest single source of leakage.
Gotcha
Show invoice price as a subtotal partway down the bridge, not just list and pocket. A subtotal bar must start from the baseline, so set its base value to zero and color it like a total. Without it, an audience cannot see how much leakage is on-invoice versus off-invoice, which is usually the whole point of the slide.
The one-prompt route: describe the bridge, get an editable slide
The invisible base series, the subtotal anchoring, and the hand-drawn connectors are exactly the kind of mechanical work that eats an evening. Oria removes it. It is an AI add-in that runs in the PowerPoint task pane and produces fully editable native PowerPoint elements in your corporate template. You describe the list-to-pocket bridge in one line and Oria renders the pricing waterfall slide for you.
Because the output is native, every bar, label, and connector stays editable. You can recolor the pocket-price emphasis, rename a leakage step, or adjust a value without rebuilding anything. The same approach handles any dense layout, from this bridge to a synergy bridge or a market sizing slide, which is why Oria suits the decks consultants and bankers actually ship.
One-line pricing waterfall prompt for Oria
The prompts that make the pricing waterfall slide sharp
These are the exact copy-paste prompts to spec the leakage data, set the emphasis, and write the title. The first three are for Oria inside PowerPoint; the last two are for working the numbers and the title in Claude before you build. Replace the bracketed parts with your own bridge.
Build the slide in Oria
Spec the list-to-pocket data and labels
Set the leakage and pocket-price emphasis
Write the action title on the slide
Work the numbers and title in Claude first
Build the bridge from raw pricing data
Sharpen the action title
Tip
Draft the bridge in Claude, then hand the clean list price, leakage steps, and pocket price straight to Oria. For the full draft-to-deck pattern under deadline, see the fastest way to build a 15-slide deck.
Common mistakes to avoid
For the wider habits that make AI-built slides look board-ready rather than generic, the consultant's guide to Claude covers the end-to-end method from analysis to deck.
Frequently asked questions
What is a pricing waterfall slide?
A pricing waterfall slide is a bridge that shows how the list price erodes to the pocket price through a sequence of deductions. Each descending step is one form of leakage: invoice discounts, off-invoice rebates, payment-term costs, and promotions. The slide makes visible where margin disappears between the price you quote and the price you actually keep.
How is a pricing waterfall different from a financial waterfall chart?
A generic financial waterfall chart bridges any two totals, such as revenue last year to this year, with steps that go up and down. A pricing waterfall is a specific application: it almost always descends from list price to pocket price, and every step is a price leakage. The shape is one-directional and the labels are fixed pricing concepts, which is why it deserves its own treatment.
What are the standard steps in a price waterfall?
The common steps are invoice discounts (volume, customer, and order-level discounts on the invoice), off-invoice rebates (annual or growth rebates paid after the fact), payment-term costs (the carrying cost of net-60 or net-90 terms), and promotions or co-op marketing allowances. Together they take you from list price to invoice price to pocket price.
What is the difference between invoice price and pocket price?
Invoice price is list price minus the discounts that appear on the invoice. Pocket price is invoice price minus everything that comes off later: off-invoice rebates, payment-term costs, and promotions. Pocket price is the money you actually keep, which is why it is the bar your audience should land on.
What is the fastest way to build a pricing waterfall slide?
Describe the bridge in one line and let Oria render it. You give the list price, each labeled leakage step, and the pocket price, and Oria builds a fully editable native PowerPoint bridge in your template, with the connectors and the pocket-price emphasis already set. You skip the invisible base series and the manual connector lines entirely.