
How to Build a Value Driver Tree Slide in PowerPoint
The practical way to build a value driver tree slide that reads at a glance: what it is, how to decompose enterprise value into MECE drivers, how to find the highest-leverage one, the exact prompts to copy, and the mistakes that make it look amateur.
Free skills and prompts for Claude and strategy work
Templates for Claude, ChatGPT and Perplexity — from diagnostics to board-ready decks.

How to build a value driver tree slide, in short
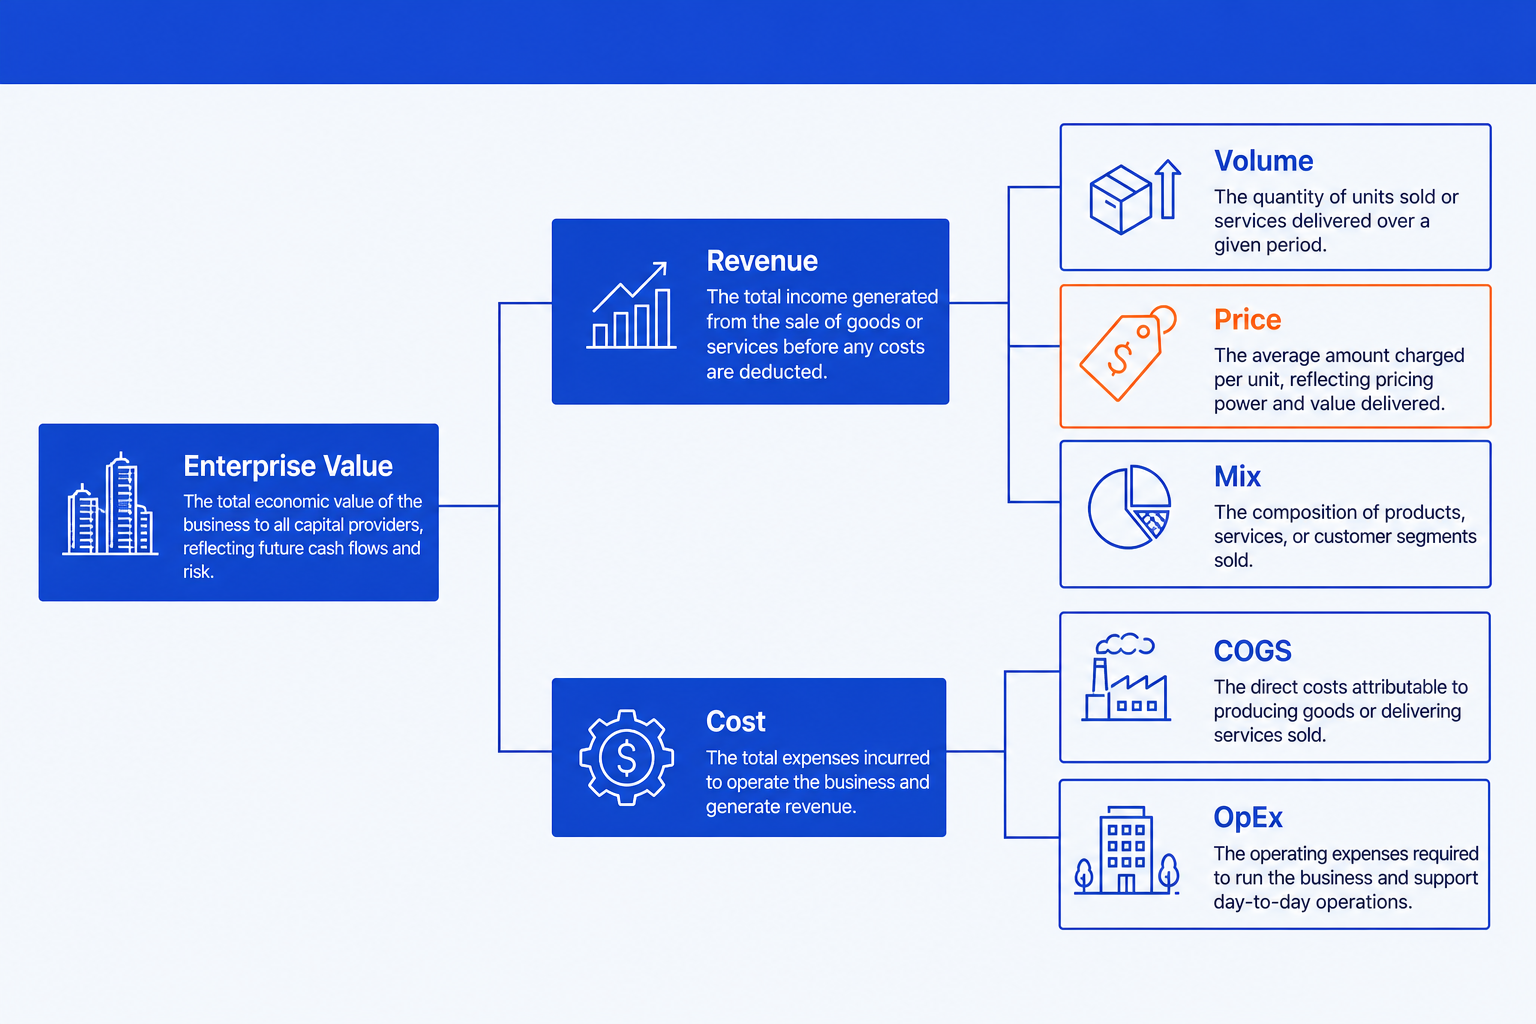
To build a value driver tree slide in PowerPoint, put the top metric, enterprise value or EBITDA, at the root, branch it into Revenue and Cost, then decompose each branch into sub-drivers: Revenue into Volume, Price, and Mix, and Cost into COGS and OpEx. Keep every branch MECE, highlight the one driver with the most leverage, and align the nodes on a clean grid. You can draw it by hand, or describe the structure in one line and let Oria render it as native, editable nodes and connectors on your template.
The hard part is rarely drawing boxes. It is the logic: making the decomposition exhaustive, keeping branches from overlapping, and choosing the level of detail that tells the story without drowning it. The rest of this guide walks that, with the exact prompts to do it fast.
When a value driver tree is the right choice
A value driver tree earns its place when the audience needs to see what moves a headline number and where to act. Use one for:
Value creation plans, mapping how an EBITDA or enterprise value target breaks into operational levers.
Diligence and investment memos, showing a buyer exactly which drivers underpin the thesis.
Performance reviews, where leadership needs to see which driver to push next quarter.
Strategy reviews, framing a single ambition as a structured set of moves rather than one number.
If the point is to quantify a bridge between two figures rather than map structure, a different layout serves better. For a financial bridge, see how to build a waterfall chart slide; for sizing a market top down, see how to build a market sizing slide.
Build the value driver tree slide step by step
Whatever tool you use, a clean tree follows the same six steps. Get the logic right first, then make it look like a board slide.
Put the top metric at the root. Place enterprise value or EBITDA as a single node on the left (or top). This is the one number everything else explains, so it anchors the whole slide.
Branch into Revenue and Cost. Split the root into two first-level branches. Revenue and Cost are mutually exclusive and together explain operating value, which makes them a clean first cut.
Decompose each branch into sub-drivers. Break Revenue into Volume, Price, and Mix; break Cost into COGS and OpEx. Stop one or two levels deep, at the drivers management can actually move.
Keep every branch MECE. At each split, check the children do not overlap and together cover the parent. If two boxes could claim the same effect, or a driver is missing, fix the cut before you style anything.
Highlight the highest-leverage driver. Mark the one driver with the most upside in a single accent color. A tree where everything looks equally important tells the reader nothing.
Align and format on a grid. Same-level nodes share a size and a baseline, connectors run clean without crossing, and the whole thing sits on your template fonts and colors.
What a clean structure looks like
The structure below shows the shape without any numbers: a single root, a clean first cut into Revenue and Cost, and one more level of sub-drivers under each. The highlighted node marks where the leverage sits. Build the logic to look like this before you add a single figure.
The one-prompt Oria route
Oria is an AI add-in that lives in the PowerPoint task pane and builds complex slides from plain inputs. For a value driver tree, you describe the decomposition in one line and Oria renders editable native nodes and connectors, on your brand. Three steps:
Write the decomposition as one line of plain text, or paste a structured P&L breakdown.
Run it through Oria's Text to Slide; it returns the tree as native shapes and connectors in your template.
Refine in PowerPoint: rename a driver, recolor the highlighted branch, or nudge a node, exactly as you would with any slide.
Because the output is fully editable PowerPoint, not a flat image, the tree stays yours after generation. For the broader workflow of turning analysis into slides, see Claude skills for slide design.
Copy-paste prompts for a value driver tree slide
These are the prompts to drive the tree. Paste a block, replace the bracketed parts, and run it in Oria's Text to Slide, or in Claude when you want the structure written out first. They are grouped by the job they do.
Decompose a P&L into a MECE tree
From a P&L to a driver structure
Build the slide from the structure
Find the highest-leverage driver
Rank drivers, then highlight one
Turn a financial model into the tree
From model tabs to a one-slide tree
Tidy a tree that is already cluttered
Tip
Run the first two prompts in order. Once Claude or Oria holds the clean MECE structure, the leverage and tidy prompts operate on it directly, so you are refining one tree rather than rebuilding it each time.
Common mistakes to avoid
Frequently asked questions
What is a value driver tree?
A value driver tree is a slide that decomposes one top financial metric, usually enterprise value or EBITDA, into the operational drivers that move it. The root sits on the left, branches into Revenue and Cost, and each of those breaks into sub-drivers such as Volume, Price, Mix, COGS, and OpEx. It turns a single number into a structured map of what management can actually pull on.
How do I keep a value driver tree MECE?
Mutually exclusive, collectively exhaustive means every branch covers a distinct slice and the slices add up to the parent. Revenue and Cost together explain operating value with no overlap. Volume, Price, and Mix together explain Revenue. If two boxes could both claim the same effect, or a driver is missing, the tree is not MECE and the logic will not hold up in review.
Should I put numbers on a value driver tree slide?
Only if they are real and you can stand behind them. The structure works without numbers, and a clean labelled tree is often the stronger board artifact. When you do add figures, anchor each leaf to a line in your model and show the unit (currency, percent, count) so the audience can trace the build from leaf back to root.
How is a value driver tree different from a waterfall chart?
A value driver tree shows the structure: how a metric breaks down into drivers, top to bottom or left to right. A waterfall chart shows the movement: how a starting figure becomes an ending figure through additions and subtractions. Use the tree to frame what drives value, and a waterfall when you need to quantify a bridge between two points in time.
Will the slide stay editable after I generate it with Oria?
Yes. Oria renders the tree as native PowerPoint shapes, text boxes, and connectors, not a flat image. You can move a node, rename a driver, restyle the highlighted branch, or apply your corporate template after generation, the same as any slide you built by hand.