
How to Make a Market Sizing Slide: TAM SAM SOM in PowerPoint
The funnel layout, how to size each TAM SAM SOM layer, how to write the action title, and the one-prompt route that lets Oria render a fully editable slide in your template.
Free skills and prompts for Claude and strategy work
Templates for Claude, ChatGPT and Perplexity — from diagnostics to board-ready decks.

How to make a market sizing slide
To make a market sizing slide, frame the opportunity as TAM, SAM, and SOM: the total addressable market, the serviceable addressable market, and the serviceable obtainable market. Lay the three figures out as a funnel or nested rings that narrow from the full universe of demand down to the share you can win. Add a one-line assumption beside each figure, and write an action title that leads with the obtainable share and the reason it matters.
In Oria, you describe the layout in natural language using the Text to Slide feature, and it renders the slide as native, fully editable PowerPoint shapes in your corporate template. Oria produces multiple design options for each input, so you review the variations and pick the strongest visual direction. This guide covers the structure, the two Oria features, and the exact copy-paste prompts.
What the market sizing slide structure looks like
A market sizing slide has three jobs: communicate the scale of the opportunity, narrow it to what you can reach, and focus it on what you can win. The TAM, SAM, SOM structure does all three in a single visual.
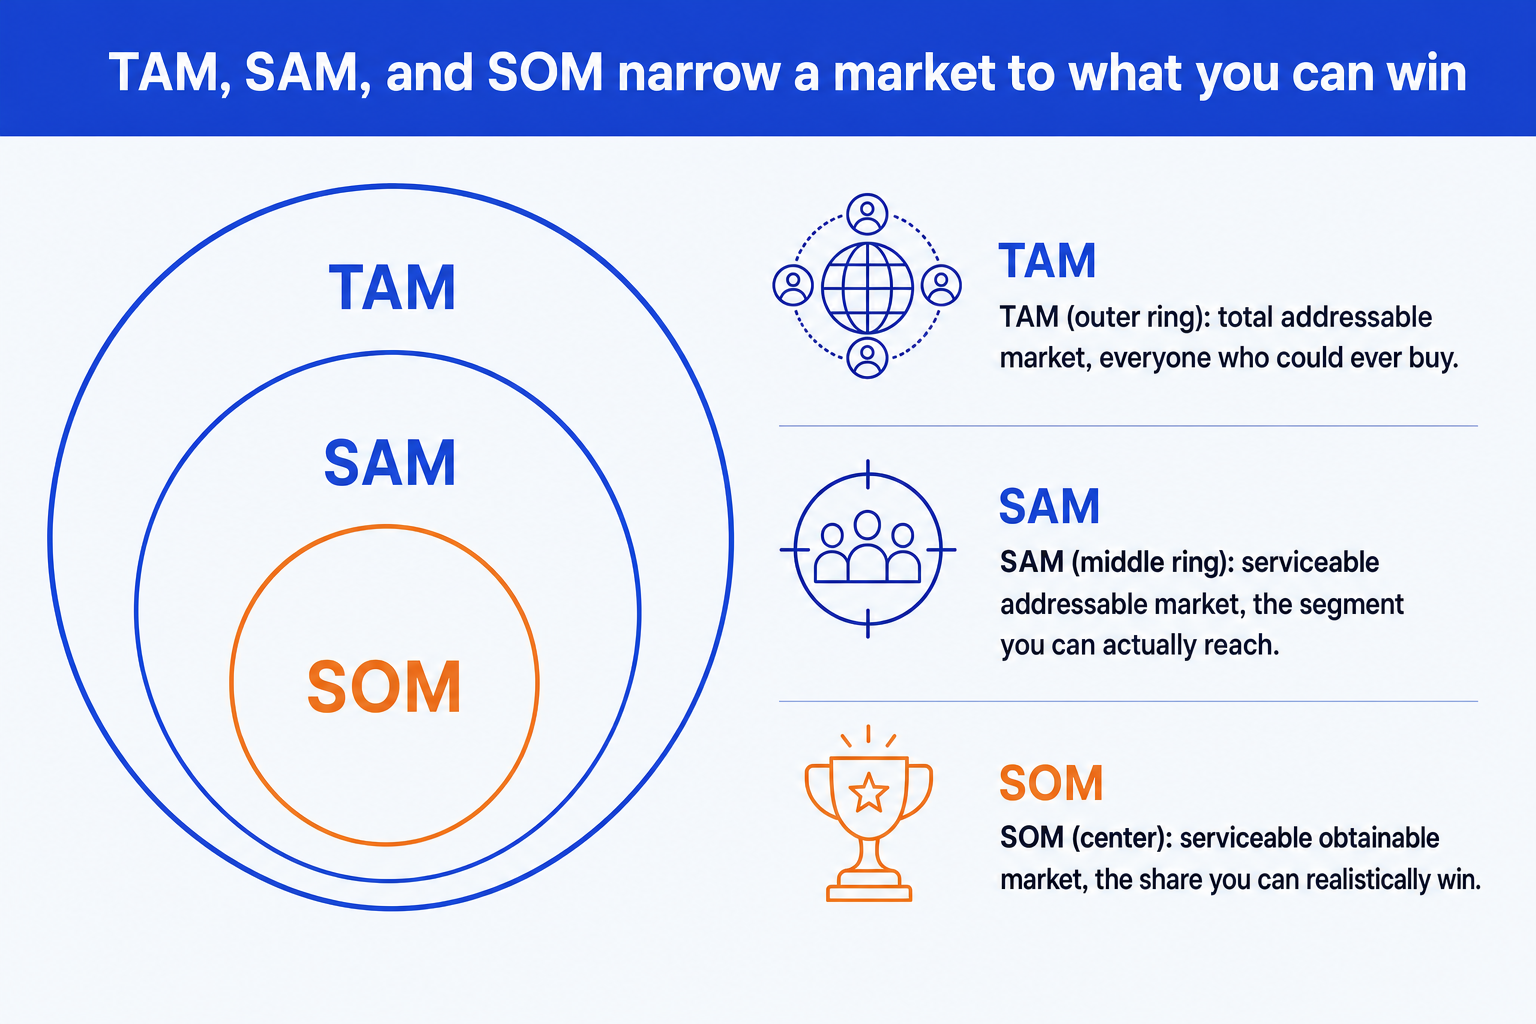
Two layout options. A nested funnel (horizontal or vertical bands narrowing from widest to narrowest) or concentric rings (circles shrinking inward). Both work. The funnel reads linearly; the rings emphasize the nesting relationship more visually.
Visual hierarchy. TAM and SAM should sit in muted tones, the foundation of the argument. SOM carries the accent color so the audience's eye lands on the obtainable share immediately. Do not let SOM blend in with the other two layers.
Assumptions beside every layer. Each band or ring needs a one-line note: the source for TAM, the segment and geography filter for SAM, and the share logic and period for SOM. Without them, the three numbers are unverifiable and the slide invites challenge.
An action title, not a topic label. Replace 'Market size' with a full sentence leading with the obtainable SOM and the single reason it is worth pursuing. The title is the slide's argument; the funnel is the evidence behind it.
For a deeper look at how to size each layer and triangulate top-down versus bottom-up estimates, read our full guide to building a market sizing slide. It covers the math, assumptions, and cross-check method in detail.
How Oria's Text to Slide builds the slide
Oria's Text to Slide feature converts a natural-language description of a slide into native, fully editable PowerPoint elements, running inside the PowerPoint task pane in your corporate template. You do not switch apps, import a file, or copy-paste from a web tool. The output is a real .pptx slide you can edit, merge, and hand to a reviewer like any other slide in the deck.
What to give Oria for a market sizing slide:
The three figures: TAM, SAM, and SOM, all in the same unit and year.
A one-line assumption for each layer: the source, the filter applied, and the share logic.
The layout preference: funnel bands or concentric rings.
Which layer carries the accent color (SOM, in almost every case).
The action title, or a request for Oria to propose one from the brief.
Give Oria those five inputs and it generates the slide in a single pass. Every shape, band, ring, label, and assumption note is a native PowerPoint element. You can reposition, retype, or recolor anything after generation without rebuilding the layout from scratch.
Reviewing Multiple Design Options for the market sizing slide
Oria's Multiple Design Options feature means every prompt produces two to five design variations of the same slide in 30 to 40 seconds. Rather than accepting a single output, you review a set and choose the visual direction that works for your audience and deck.
For a market sizing slide, evaluate each option on four criteria:
SOM emphasis
Does the accent color land clearly on SOM? If the innermost ring or bottom band blends in with the others, the option is not serving the argument.
Assumption visibility
Are the one-line notes beside each layer readable at the slide size you need? An option that crowds them below the funnel is harder to present.
Content density
Does the layout hold the number of data points you have? A spare funnel needs more white space; a triangulated build with source notes fills more of the slide.
Template fidelity
Oria holds your corporate fonts, colors, and layout patterns across variations. Confirm each option respects your master and does not drift off-brand.
If no variation is quite right, follow up with a refinement prompt. Oria's conversational mode lets you adjust emphasis, swap a funnel for rings, move the assumption notes, or change the title without starting again. The approach is closer to a designer review than a single-shot generation.
The prompts for making a market sizing slide in Oria
Below are the exact copy-paste prompts. The first four go into Oria's Text to Slide feature inside PowerPoint. The last two go into Claude to size and triangulate the market before you hand the figures to Oria. Replace the bracketed parts with your own data.
Build the slide in Oria
Generate the initial funnel layout
Add assumptions to each layer
Write and set the action title
Request the concentric ring alternative
Size the market in Claude first
Size and triangulate the market
Generate three action title options
Tip
Size and triangulate in Claude first, then hand the clean figures and their assumptions to Oria. For a related numeric exhibit, see how to build a waterfall chart slide, which bridges the components that make up a total.
Common mistakes to avoid
For the wider context on why the technical approach behind your AI slide tool affects output quality, read the explainer on the three approaches to AI slide generation. It explains why Oria's visual rendering method produces sharper exhibit output than template-based or HTML-based tools.
Frequently asked questions
What is a market sizing slide?
A market sizing slide frames a business opportunity as TAM, SAM, and SOM: the total addressable market, the serviceable addressable market, and the serviceable obtainable market. The slide shows the three figures narrowing from the broadest universe of demand down to the realistic share you can win, with the assumptions behind each step visible so the audience can follow and trust the logic.
Which layout should I use: funnel or concentric rings?
Both work. The funnel reads linearly from top to bottom and flows naturally for an audience reading down the slide. Concentric rings emphasize the nesting relationship and work well when the three figures are the headline. The choice comes down to deck style and how much explanatory text you need beside each layer. Oria produces both as options in its Multiple Design Options output, so you can compare them side by side before deciding.
How do I write the action title for a market sizing slide?
Replace the topic label with a full sentence stating the so-what. Lead with the obtainable SOM figure and the single reason it is worth pursuing. A topic title reads: 'Market size.' An action title reads: '[SOM value] is reachable in [period] because [reason].' The title is the argument; the funnel is the evidence. Use Oria or Claude to generate three title options and choose the sharpest one.
How do I use Multiple Design Options for a market sizing slide?
When you submit the prompt to Oria, it generates two to five design variations of the same layout within 30 to 40 seconds. Each uses a different visual treatment of the same TAM, SAM, SOM data. Look for the option that gives SOM the strongest emphasis, keeps the assumption notes readable, and holds your corporate template. If no option is exactly right, follow up with a refinement prompt to adjust specific elements without starting again.
What is the fastest way to make a market sizing slide in PowerPoint?
Describe the slide to Oria's Text to Slide feature inside the PowerPoint task pane. Give it the three figures, their units and year, a one-line assumption for each, and your layout preference. Oria generates two to five fully editable native PowerPoint options in 30 to 40 seconds. You pick the best one, refine the title with a follow-up prompt, and the slide is ready. No shape alignment, no connector work, no template adjustment.