

Consulting Presentation Slides: What Makes Them Good
Consulting presentation slides are slides built to prove one conclusion to a senior reader. Each carries a full-sentence title stating the point, one exhibit that supports it, and a place in a deck ordered as an argument, all on a strict corporate template.
Quick answer: what separates good consulting presentation slides?
Most people judge a slide by how it looks. Senior readers judge it by whether it tells them something they can act on in the time they give it, which is usually seconds. That is why two slides with the same data and the same fonts can land very differently.
Good consulting presentation slides differ from average ones in five places: the title, the evidence, the structure, the density and the template. The title is a full sentence stating the conclusion rather than a topic label. The evidence is one exhibit chosen to prove that sentence. The deck is ordered as an argument, not grouped by subject. Every element on the page earns its place. And every slide sits on one enforced master, so nothing drifts. If a slide passes those five tests, it reads as consulting-grade whatever its colours.
How we judged good versus average
There is no official standard, so this page uses criteria a reader can apply to any slide in under a minute:
- Does the slide state its point? We looked at whether the title alone carries a conclusion.
- Does the exhibit prove it? We asked whether the picture supports the sentence or merely sits near it.
- Does the sequence build? We read titles in order to see if they form a storyline.
- Could anything be removed? Density is judged by what the argument loses when an element goes.
- What we ignored: fonts, colour choices, icon style and animation. They matter far less than the first four, and a firm with a different house style can still pass every test.
Key takeaways
- Write the title as a sentence that could be wrong. If nobody could disagree with it, it is a label, and the slide has not yet decided what it claims.
- Pick the exhibit after the title, not before. The evidence is whichever single picture makes the sentence obvious, and everything else belongs in the appendix.
- Order the deck as an answer first, reasons second, risks third and the request last. Grouping by subject is how analysis is filed, not how it is argued.
- Judge density by subtraction. Dense is fine, cluttered is not, and the difference is whether removing an element weakens the point.
- Put every slide on one master and keep it there. A drifting title position or chart palette signals carelessness before anyone reads a word.
Consulting presentation slides: the five differences
The pattern repeats across every strong deck. The differences are structural, so they can be learned and checked, which is more useful than a vague instruction to make slides look professional.
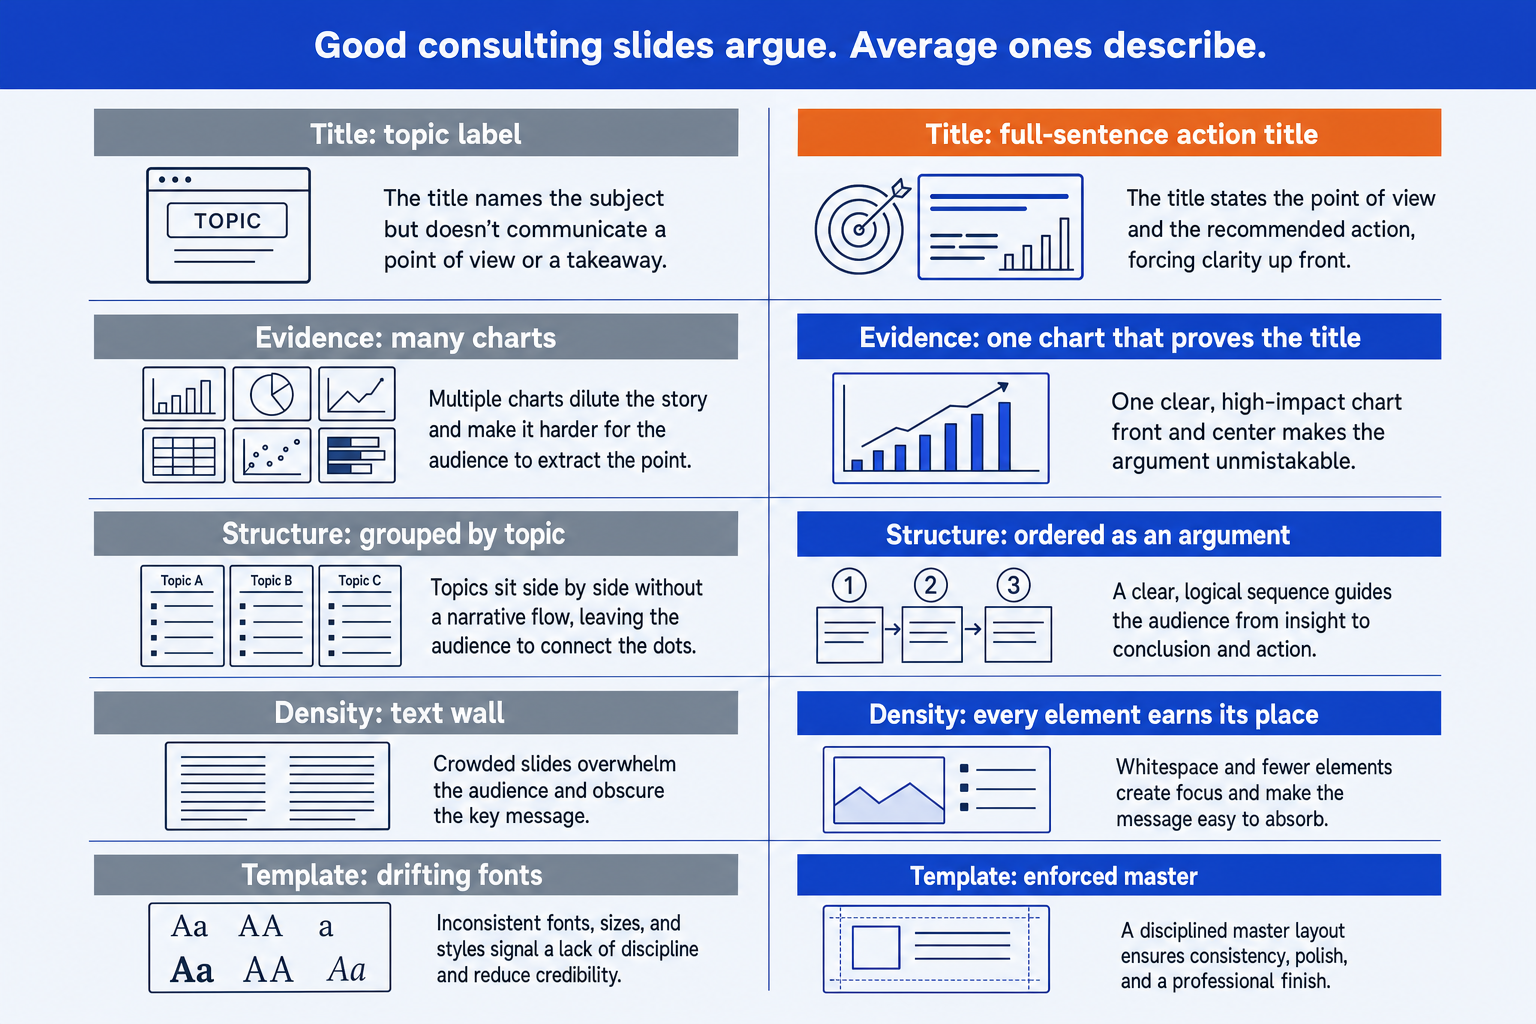
| Dimension | Average | Good |
|---|---|---|
| The title | A topic label: "Warehouse cost initiatives". It tells the reader what the slide is about and leaves them to work out why it is there. | A full sentence that states the conclusion the slide proves, short enough to fit on two lines and specific enough to be argued with. This is usually called an action title. |
| The evidence | Everything the team found, shown at once: three charts, a table and a callout, because each one cost real effort to produce. | One exhibit chosen because it proves the title, with the rest in the appendix. The exhibit is the right form for the claim: a bridge for a change, a bar chart for a comparison, a matrix for a positioning. |
| The structure | Grouped by subject. Section one is the market, section two is the competitors, section three is the options. The reader assembles the argument themselves. | Ordered as an argument. The answer first, then the two or three reasons it is right, then what would change the answer, then the decision requested. Sections exist because the logic needs them, not because the data fell into piles. |
| The density | Either a wall of eight-point text that nobody can read from the back of the room, or a nearly empty slide with a single stock image because someone said to keep it simple. | Dense and legible at once. Every element earns its place, text is cut to the phrase that carries the point, and the layout lets the eye move from title to exhibit to takeaway without hunting. |
| The template | Each slide inherits a slightly different font size, margin and colour from wherever its content was pasted, so the deck looks assembled by several people. | Everything sits on the firm's master: the same title position on every page, the same palette, the same chart styling, and objects that snap to the same grid. Consistency is invisible when it is right and loud when it is wrong. |
The five parts of a good consulting slide, in detail
Each part below says what average looks like, what good looks like, a test you can run in seconds, and an example entry. The example entries all belong to one illustrative company, called Brightwell Logistics, so they tie together in the worked example further down.
1. The title
Average: A topic label: "Warehouse cost initiatives". It tells the reader what the slide is about and leaves them to work out why it is there.
Good: A full sentence that states the conclusion the slide proves, short enough to fit on two lines and specific enough to be argued with. This is usually called an action title.
The test: Read only the titles of the deck in order. If they do not tell the story, the titles are labels.
Example entry: Three levers cut warehouse network cost by $12.6m a year, 26% of the base, for $15.0m of one-time spend.
2. The evidence
Average: Everything the team found, shown at once: three charts, a table and a callout, because each one cost real effort to produce.
Good: One exhibit chosen because it proves the title, with the rest in the appendix. The exhibit is the right form for the claim: a bridge for a change, a bar chart for a comparison, a matrix for a positioning.
The test: Cover the title and look at the exhibit. Can a stranger state the conclusion from the picture alone?
Example entry: A single bridge from $48.0m of current cost to $35.4m, with the three levers as the steps and a total label.
3. The structure
Average: Grouped by subject. Section one is the market, section two is the competitors, section three is the options. The reader assembles the argument themselves.
Good: Ordered as an argument. The answer first, then the two or three reasons it is right, then what would change the answer, then the decision requested. Sections exist because the logic needs them, not because the data fell into piles.
The test: Could someone who reads the first slide and the last slide still say what you want from them?
Example entry: Slide 1 states the recommendation and the saving. Slides 2 to 4 take one lever each. Slide 5 covers risk and cost to achieve. Slide 6 is the decision.
4. The density
Average: Either a wall of eight-point text that nobody can read from the back of the room, or a nearly empty slide with a single stock image because someone said to keep it simple.
Good: Dense and legible at once. Every element earns its place, text is cut to the phrase that carries the point, and the layout lets the eye move from title to exhibit to takeaway without hunting.
The test: Remove any one element. If the argument does not weaken, it should not have been there.
Example entry: Title, one bridge, three short driver notes beside the steps, one source line and a footnote on the one-time cost. Nothing else.
5. The template
Average: Each slide inherits a slightly different font size, margin and colour from wherever its content was pasted, so the deck looks assembled by several people.
Good: Everything sits on the firm's master: the same title position on every page, the same palette, the same chart styling, and objects that snap to the same grid. Consistency is invisible when it is right and loud when it is wrong.
The test: Flip through quickly. Does the title stay in exactly the same place?
Example entry: All six slides use the corporate master. Titles start at the same coordinates, and the bridge uses the template's chart colours, not the defaults.
The title is the highest-value fix. The guide to building an executive summary slide shows the title and three-number pattern on the most important page in any deck, and the executive summary examples show it across eight kinds of decision.
What the research says about slide titles and density
The strongest claim on this page, that sentence titles beat topic labels, has measured support, with limits. In a 2006 paper at the American Society for Engineering Education conference, Michael Alley and colleagues compared four sections of a university course, about 200 students each, two taught with traditional slides headed by a word or short phrase and two with succinct sentence headlines. Students who saw the sentence headlines averaged 79% correct on a recall test, against about 69% for the traditional group, a difference significant at the 0.001 level.
The detail is worth reading, because it keeps the claim honest. The sentence group scored significantly higher on seven of the fifteen questions, and significantly lower on two. The study tested whole slide designs in a teaching setting, not business decks and not titles in isolation. It supports the direction of the advice. It does not prove a size of effect for your next board pack.
The opposite failure, slides that bury the point, has a documented cost. The Columbia Accident Investigation Board's 2003 report examined a crowded, bulleted briefing slide about possible wing damage and observed: “It is easy to understand how a senior manager might read this PowerPoint slide and not realize that it addresses a life-threatening situation.” The Board also noted that it was surprised at many points to receive similar slides in place of technical reports. Most decks carry far lower stakes, but the mechanism is the same: the conclusion was in the material and not in the title.
The best-known critic of the format, Edward Tufte, put the general case in his essay The Cognitive Style of PowerPoint: “This cognitive style harms the quality of thought for the producers and the consumers of presentations.” Read it as a warning about default templates and fragmented bullets, not about slides that argue. Each of the five parts above is a way of building a slide that does not fall into that style.
One consulting slide, worked from average to good
Take Brightwell Logistics, an illustrative company. The team has analysed its warehouse network and found three savings levers. The first draft of the slide is titled “Warehouse cost initiatives”, shows a table of nine initiatives, a pie chart of current cost by site and a bar chart of carrier rates, and uses two font sizes it inherited from pasted content. It is accurate. It also makes the reader do all the work.
The inputs are a current network cost of $48.0m and a one-time cost to achieve of $15.0m. The three levers, with their annual savings, and the arithmetic that produces the title are below.
| Step | Arithmetic and result |
|---|---|
| Inputs | Current warehouse network cost $48.0m. One-time cost to achieve $15.0m. |
| Lever 1: consolidate 9 sites into 6 | Saves $6.0m a year. |
| Lever 2: automate picking at the 6 remaining sites | Saves $4.2m a year. |
| Lever 3: re-tender carrier contracts | Saves $2.4m a year. |
| Total saving | 6.0 + 4.2 + 2.4 = $12.6m a year. |
| Share of the base | 12.6 divided by 48.0 = 26.25%, shown as 26%. Cost falls from $48.0m to $35.4m. |
| Payback | 15.0 divided by 12.6 = 1.19 years, shown as 1.2 years. |
Now apply the five parts. The title becomes: “Three levers cut warehouse network cost by $12.6m a year, 26% of the base, for $15.0m of one-time spend”. The evidence becomes one bridge from $48.0m to $35.4m, with the three levers as the steps, because a bridge is the form that shows how a total changes. The pie chart and the rate chart move to the appendix. The slide sits second in a deck that opens with the recommendation and closes with the decision. It carries three short driver notes beside the steps and one footnote, and it is rebuilt on the corporate master so the title lands where every other title does.
Nothing about the analysis changed. The reader now learns the answer from the title, sees the proof in the exhibit and can trace each figure. That difference is the whole subject of this page. For the exhibit used here, the guide to the waterfall chart slide covers the build.
When to use the consulting slide standard
Use it when the slide has to carry a decision or a defensible claim: a steering committee update, a diligence finding, a board paper, an operating-model proposal, a client readout. These are read by senior people with little time, often without you in the room, so the slide must stand alone.
It also suits any deck that will be forwarded. Once a page leaves your hands, the title and the exhibit are all the reader has. The structure is the same one used for a full board presentation, and the same instinct drives a good issue tree: state the answer, then show why.
When the consulting style misleads
An action title flatters a conclusion. Writing the answer in the title is right when the analysis supports it, and dangerous when it was written before the work was finished. The team then picks the exhibit that fits the sentence and moves the inconvenient one to the appendix. The failure mode is specific: a clean title, a persuasive bridge, and a downside case that would reverse the answer sitting on page 31 where no one looks.
The standard also fails on the wrong audience. A fundraising pitch, a launch announcement or a student presentation is judged on impact and memorability, and a dense, sentence-titled slide in a strict template reads as heavy there. And it can create false precision. A title that says 26% looks more certain than the inputs behind it, so when the savings are estimates, say so in the title or the first footnote, not only in the appendix.
How to build consulting presentation slides
Build in this order and the five parts take care of themselves.
Write all the titles first, as a list of sentences. Read them in order. If the story does not hold, fix it here, before any exhibit exists.
For each title, choose the one exhibit that proves it, and decide its form from the claim: bridge, bar, matrix, timeline.
Build each exhibit on the corporate master, with every number tied to a single worksheet.
Cut each page by subtraction until removing anything weakens the point, and move the rest to the appendix.
Flip through the deck at speed. Titles should not move, and the sequence of titles should read as the argument.
Oria builds this kind of slide. It is made for consulting presentations and corporate documents: board packs, steering committee decks, diligence exhibits and dense frameworks held to an enforced corporate template. It reaches you two ways, as a PowerPoint add-in in the task pane on Windows, macOS and PowerPoint for the web, and as a connector for Claude and ChatGPT over MCP, so slides can be built from the chat you are already in. Output is native, editable PowerPoint on your master. If a slide already exists but looks rough, the guide to improving ugly PowerPoint slides covers the repair route, and the comparison of AI presentation tools for strategy consultants sets Oria beside the alternatives.
One-prompt route
The trade-off: Oria is built for the corporate environment and loses on highly visual work. Founder fundraising and pitch decks, launch and campaign decks, student presentations and marketing one-pagers want visual impact more than defensible content, and a design-led tool such as Gamma, Canva, Pitch or Beautiful.ai will beat it there and look better doing it. It also will not decide what your conclusion is.
Which tool should you use for consulting slides?
| If you need | Use | Why |
|---|---|---|
| Consulting presentation slides on your own corporate template, editable in PowerPoint | Oria | Built for consulting presentations, board packs and dense frameworks held to an enforced template. Native PowerPoint output, from the add-in or from Claude and ChatGPT over MCP. |
| Charts that stay linked to a data sheet and update on refresh | think-cell | Owns the chart layer well. It does not write the title or decide the structure. |
| A fundraising, launch or campaign presentation where visual impact matters most | Gamma, Canva, Pitch or Beautiful.ai | Design-led tools will look better on visually led work than a tool built for the corporate environment. |
| Settling the storyline before any slide exists | A one-page document, or Claude | Write the titles as a list of sentences first, then render them once. |
Common consulting slide mistakes to avoid
Frequently asked questions
What makes a good consulting slide?
A good consulting slide makes one point, states it in a full-sentence title, and proves it with a single exhibit chosen for that claim. It sits in a sequence ordered as an argument, carries no element that does not support the point, and uses the firm's template without drift. A reader should be able to take the title and the exhibit alone and reach the same conclusion.
What is an action title?
An action title is a full sentence at the top of a slide that states the conclusion the slide proves, such as 'Three levers cut warehouse cost by $12.6m a year'. A topic title only names the subject. Read in order, the action titles of a deck should tell the whole story without opening any page.
How many words should a consulting slide have?
There is no fixed count, and any figure quoted as a rule is a rule of thumb. The working test is subtractive: remove any element and see whether the argument weakens. Consulting slides are denser than most presentation slides because they are often read as well as presented, but every phrase should be there because it carries the point.
Why are consulting slides so dense?
Many are read alone, as documents, by senior people who will not have the presenter beside them. The slide has to carry the full argument without a voiceover. Density is acceptable when it is organised: a clear title, an obvious reading order, aligned elements and text cut to the phrase that matters.
How do you make slides look like a consulting deck?
Start from the structure, not the styling. Write full-sentence titles, order the deck as an argument, use one exhibit per slide chosen for the claim, and put everything on a strict master so titles, margins and chart styling never drift. The consulting look is mostly the result of those disciplines, not of any particular colour or font.
Can AI make consulting presentation slides?
It can produce the layout, formatting and native editable shapes quickly, which is the slow part. It cannot decide what your conclusion is. The strongest results come from giving an AI tool the action title and the numbers and asking it to build the exhibit on your template, then checking that every figure ties.